|

|
Nevron Chart for SharePoint
Nevron Chart for SharePoint is an advanced web part, delivering a complete and unmatched set of 2D and 3D charting types, highly customizable axes, advanced data analysis, numerous tuning options and stunning visual effects to your SharePoint sites. Ключевые слова:
SharePoint, SharePoint charts, SharePoint chart, chart sharepoint, moss chart
Скачать бесплатно! (32 Mb)
|
|

|
Magico Chart
Magico chart is a tool to make especial chart. Different from traditional charts, this software can make chats will icon of the objects to be analysed. These lively statistical charts can bring a beam of light in your business report. Ключевые слова:
statistical chart, chart, data analysis
Скачать бесплатно! (1.14 Mb)
|
|

|
TeeChart Pro ActiveX
TeeChart ActiveX charting component offers hundreds of Graph styles in 2D and 3D, 56 mathematical and statistical Functions for you to choose from together with an unlimited number of axes and 14 toolbox components. For Windows and Web applications. Ключевые слова:
ActiveX charting component, ActiveX Chart, Chart for COM, IIS, ASP
Скачать бесплатно! (32 Mb)
|
|

|
Chartgantt Basic Demo
Chartgantt templates offers users functionality not previously found in excel based gantt charts. There are 5 different paid versions of the software to meet the most sophisticated planning needs. These tools have been tested by over 1000 users. Ключевые слова:
Gantt Chart, Gantt Chart Excel, Gantt Chart Template, Free Gantt Chart
Скачать бесплатно! (466 Kb)
|
|

|
RFFlow
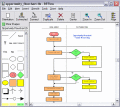
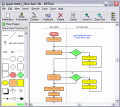
RFFlow is a drawing tool that allows you to quickly and easily draw flowcharts, organization charts, audit charts, cause-effect (fishbone) diagrams, PERT charts, Gantt charts, database definitions, electronic schematics, and more. Ключевые слова:
flowchart, flow chart, organization chart, graphics, diagram software
Скачать бесплатно! (5.49 Mb)
|
|

|
RFFlow Flowchart Software
RFFlow is a drawing tool that allows you to quickly and easily draw flowcharts, organization charts, audit charts, cause-effect (fishbone) diagrams, PERT charts, Gantt charts, database definitions, electronic schematics, and more. Ключевые слова:
flowchart, flow chart, organization chart, graphics, diagram software
Скачать бесплатно! (5.26 Mb)
|
|

|
ASP.NET Report Maker
ASP.NET Report Maker is a powerful reporting tool that can generate dynamic ASP.NET Web Pages (VB or C#) from Microsoft Access, SQL Server, MySQL, PostgreSQL, and Oracle. Ключевые слова:
ASP, ASP.NET, Web Pages, VB.NET, C
Скачать бесплатно! (21.5 Mb)
|
|

|
OrgChart JS
A JavaScript library for building interactive Org-Charts, specifically tailored for displaying a company's organizational structure Ключевые слова:
orgchart js, org chart, organizational chart, org-chart html, tree js
Скачать бесплатно! (70 Kb)
|
|

|
Nevron Open Vision
Nevron Open Vision for .NET is a suite of advanced desktop UI controls that aims to streamline the development of feature-rich Desktop Applications by providing developers with premium quality UI controls that also work on multiple operating systems. Ключевые слова:
Chart, Diagram, Graph, Scheduler, Grid
Скачать бесплатно! (370.88 Mb)
|
|

|
Triangle Chart Patterns Software
Triangle pattern is the most traded chart pattern in currency trading. There are three types of triangles most traded in currency trading. Ключевые слова:
Triangle chart patterns, nifty live chart, candlestick patterns, technical charts, trading charts
Скачать бесплатно! (488 Kb)
|
|
Страница: 1
| 2
| 3
| 4
| 5
|
|
|
|
