|
|
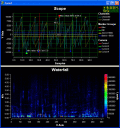
PlotLab VC++
PlotLab is a set of Visual C++ components for very easy and fast Data Visualization. They allow very fast display in a Plot/Scope/Chart or Waterfall form. Great for FFT Visualization! Free for non-commercial use. Ключевые слова:
Chart, Scope, Plot, Waterfall, Plotting
Скачать бесплатно! (32 Mb)
|
|

|
Dashboard Cola
Dashboard Cola is an interactive visualization dashboard designer where the user are able to click and drill down the data. The charting support various type of interactive charting. Ключевые слова:
dashboard, release
Скачать бесплатно! (32 Mb)
|
|
|
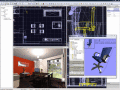
Flow Architect Studio 3D
PIXELPLAN Flow Architect Studio 3D is a software package that enables a simple and easy way to create interactive 3D visualization - virtual walks. Ключевые слова:
3D, graphics, visualization, virtual walk, architecture
Скачать бесплатно! (32 Mb)
|
|

|
Analysis Studio
An intuitive and powerful statistical analysis and data mining tool. Analysis Studio features a fast deep logistic regression model development and deployment, regression analysis, crosstab tables. Free license key: A294A50066D2E03AE86C Ключевые слова:
Data Mining, Statistical Analysis Software, Predictive Analysis, Predictive Analytics, Decision Support Systems
Скачать бесплатно! (4.31 Mb)
|
|

|
3DGeoStats - a 3D Data Visualization
3DGeoStats is a three dimensional, interactive visualization of the earth showing arbitrary statistical data. The data connected to geo coordinates is represented as markers. The component is a pure Actionscript 3 Library with an API. The sample abov Ключевые слова:
flash components, actionscript, video player, audio, flash galleries
Скачать бесплатно! (4.88 Mb)
|
|

|
FasteR
FasteR Desktop is a combination of GUI and IDE for R statistical language. FasteR Desktop is stand-alone independent application for R. This application allows you to use mutliple tools and features for produsing R code. Ключевые слова:
R, statistics, data processing, visualization, R language
Скачать бесплатно! (1.77 Mb)
|
|

|
DataPult Desktop
Самостоятельное приложение для ПК DataPult Desktop быстро создаст тепловую карту по вашим данным. Импорт данных из MS Excel. Возможность создания интерактивной анимированной карты на данных за несколько лет. Доступны другие типы диаграмм. Ключевые слова:
visualization, heat map, dynamic maps, heat maps for Excel, build a map in Excel
Скачать бесплатно! (20.96 Mb)
|
|

|
XpoLog Center
XpoLog log data analysis platform is an advanced data processing systems for log data, applications and cloud infrastructure. XpoLog help to quickly collect parse and index massive volume of log data. No agents, tags or changes are required. Ключевые слова:
xpolog, log parser, log analyzer, log analysis, event log
Скачать бесплатно! (32 Mb)
|
|
|
TextPipe Pro
Powerful text-processing workbench combining 300+ conversion, transformation, extraction and report mining operations on UNLIMITED text or binary files of UNLIMITED size. Text mine / extract data from mainframe EBCDIC COBOL copybooks, data historian Ключевые слова:
extract, mine, data mine, mining, report mining
Скачать бесплатно! (26.36 Mb)
|
|
|
QTXL
QTXL - real-time streaming and snapshot quotes interface between QuoteTracker and Microsoft Excel. It downloads quotes from data sources available at QuoteTracker into Excel and thus allows performing quotes analysis and data visualization. Ключевые слова:
QuoteTracker, QTXL
Скачать бесплатно! (1.34 Mb)
|
|
Страница: 1
| 2
| 3 | 4
| 5
|
|
|
|
