|

|
Aquarium Lab
Properly monitoring and maintain aquarium conditions can lead to a truly beautiful and healthy aquarium. Aquarium Lab makes it easy to track and graph water quality conditions for 21 different parameters, and publish html reports on your web site. Ключевые слова:
aquarium, fish, tank, web, html
Скачать бесплатно! (32 Mb)
|
|

|
WinDraw
This software utility can plot regular or parametric functions, in Cartesian or polar coordinate systems, and is capable to evaluate the roots, minimum and maximum points as well as the first derivative and the integral value of regular functions. Ключевые слова:
function, graph, plot, parametric, polar
Скачать бесплатно! (1.18 Mb)
|
|

|
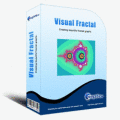
Visual Fractal
With this interesting fractal software, you can use Newton's method to solve a complex equation and show the fractal graph in the plot area. Ключевые слова:
fractals, fractal software
Скачать бесплатно! (1.26 Mb)
|
|

|
VDS ODBC
This library allows to extend possibilities of programming of Visual Dialog Script language firm S.A.D.E. ver. 5.X or high: Grid, Element of date, Graph, EditBox etc. The library works through ODBC driver. Ключевые слова:
Visual Dialog Script, VDS, ODBC, VDSODBC, AddIn
Скачать бесплатно! (1.7 Mb)
|
|

|
OLAP Reporting Tool
Data for business intelligence (BI) is of little use until it is converted into the information that decision makers need. OLAP Reporting Tool extends the built-in OLAP features in Excel to make them easier work with, especially for workgroups. Ключевые слова:
Excel, OLAP, extensions, add-ons, databases
Скачать бесплатно! (367 Kb)
|
|

|
Datastead DirectShow Capture to FFmpeg command-line
DirectShow Sink/writer filter able to compress or encode by invoking in the background ffmpeg.exe Ключевые слова:
ffmpeg, directshow, ffmpeg.exe, directshow to ffmpeg, directshow compressor
Скачать бесплатно! (13.4 Mb)
|
|

|
Options Trading Tool
This program helps you as options trader to optimize your strategy. You can add all the options you want to buy or sell and build your strategy. The program shows you the profit and loss graph at expiration and on the day that you select. Ключевые слова:
options, stocks, futures, trading, trader
Скачать бесплатно! (1.64 Mb)
|
|

|
J4L-RChart for Android
Charting package for Android (2D and 3D charts). It supports more than 18 different chart types like piecharts, linecharts, barcharts, areacharts and more. Ключевые слова:
java, chart, charts, graph, jsp
Скачать бесплатно! (2.02 Mb)
|
|

|
Algebrus
Scientific calculations and data analysis software. 2D and 3D graphic plots of functions and data. Calculations with vectors, matrices, tensors, complex numbers, fractions, quaternions, polynomials. Data fitting, statistics, optimization, spectrums. Ключевые слова:
technical calculations, scientific analysis, statistics, 2D graph, 3D graph
Скачать бесплатно! (2.82 Mb)
|
|

|
Animated Chart
Flash charts made easy. Software for generating animated interactive Flash charts and graphs for publishing to websites. Making graphs with Animated Chart is simple and quick and doesn't require any special knowledge of Flash or HTML. Ключевые слова:
flash chart, chart bar, chart line, chart data, graphs bar
Скачать бесплатно! (2.67 Mb)
|
|
Страница: 1
| 2
| 3
| 4
| 5
|
|
|
|
