|

|
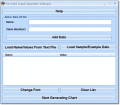
Pie Chart Graph Generator Software
Create pie charts based on numbers and their corresponding labels. Ключевые слова:
creating pie charts, graph, graphing, statistics, without excel
Скачать бесплатно! (754 Kb)
|
|

|
.NET Dashboard Suite
.NET Dashboard Suite – пакет .NET компонентов, позволяющих создавать сложные электронные инструментальные панели. .NET Dashboard Suite включает компонент для создания программных эмуляторов устройств и компонент для построения графиков и диаграмм. Ключевые слова:
.net dashboard, gauges .net, digital dashboard, KPI dashboard, net widgets
Скачать бесплатно! (32 Mb)
|
|

|
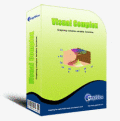
Visual Complex For Academic
Visual Complex is a graph software to create graph of complex function. 3D function graphs and 2D color maps can be created with this grapher. Ключевые слова:
complex grapher, graph software, complex graphs
Скачать бесплатно! (1.86 Mb)
|
|

|
TeeChart for Javascript
100% Javascript charting library that plots charts to all compatible browsers using the HTML5 Canvas. Available as a standalone product and as an export format across the TeeChart product range. Free for non-commercial use. Ключевые слова:
html5, javascript, javascript charting, js chart, jscript
Скачать бесплатно! (2.32 Mb)
|
|

|
Live Forex Charts
Free, simple and powerful live forex charts software provides traders with comprehensive view of the online trading charts and access to currency movements. Real-time fx and currency charts with technical indicators and online forex charting tool. Ключевые слова:
forex charts, forex chart, fx charts, forex charting, real time forex chart
Скачать бесплатно! (1.71 Mb)
|
|

|
UIChart iOS component
The Rustemsoft UIChart control enables to create iOS apps with simple, intuitive, and visually compelling chart for complex statistical or financial analysis in different graph types that include Pie, Bar, Line, Cylinder, Area, and other chart types. Ключевые слова:
UIChart, chart, ios chart, iphone, ipad
Скачать бесплатно! (3.05 Mb)
|
|

|
Eclipse Stock Charts Lite
"Eclipse Stock Charts Lite. Free Stock Charting Software with historical charts, technical analysis indicators and news." Ключевые слова:
stock, charting, software
Скачать бесплатно! (26.68 Mb)
|
|

|
Excel Extract Data From Charts or Graph Software
Extract data from one or more charts in MS Excel. Save results as text files. Excel 2000 or higher required. Ключевые слова:
charting, graphing, plot, changing, change
Скачать бесплатно! (755 Kb)
|
|

|
PDF Chart Creator Dynamic Link Library
Create high quality PDF area, bar, line and pie charts quickly and easily from data royalty free using a Dynamic Link Library (DLL). Fully documented API can be included and used with most development environments regardless of language used. Ключевые слова:
bar, pie, area, line, bar chart
Скачать бесплатно! (401 Kb)
|
|

|
DataPult Desktop
Самостоятельное приложение для ПК DataPult Desktop быстро создаст тепловую карту по вашим данным. Импорт данных из MS Excel. Возможность создания интерактивной анимированной карты на данных за несколько лет. Доступны другие типы диаграмм. Ключевые слова:
visualization, heat map, dynamic maps, heat maps for Excel, build a map in Excel
Скачать бесплатно! (20.96 Mb)
|
|
Страница: 1
| 2
| 3
| 4
| 5
|
|
|
|
