|

|
Visual Fractal
With this interesting fractal software, you can use Newton's method to solve a complex equation and show the fractal graph in the plot area. Ключевые слова:
fractals, fractal software
Скачать бесплатно! (1.26 Mb)
|
|

|
DataScene Express
DataScene Express is a data graphing and charting program. It allows the user to plot 39 types 2D & 3D graphs with brilliant quality. It supports a wide variety of graphical elements and is an ideal tool for scientific graphing and office uses. Ключевые слова:
Scientific, Data Graphing, Plotting, Charting, Graphing Software
Скачать бесплатно! (32 Mb)
|
|

|
Visual Fitting
Math tool for linear, nonlinear curve fitting and surface fitting, curve and surface can be created. Ключевые слова:
curve fitting, surface fitting, nonlinear curve fitting
Скачать бесплатно! (2.44 Mb)
|
|

|
Manco.Chart for .NET
Manco.Chart for .NET is a powerful charting component used to create attractive 3D and 2D charts for desktop applications and web pages using .NET technologies. 3D charting uses the OpenGL graphics engine to create sophisticated 3D charts and graphs. Ключевые слова:
.NET, chart, control, charting, Windows
Скачать бесплатно! (6.46 Mb)
|
|

|
Animated Chart
Flash charts made easy. Software for generating animated interactive Flash charts and graphs for publishing to websites. Making graphs with Animated Chart is simple and quick and doesn't require any special knowledge of Flash or HTML. Ключевые слова:
flash chart, chart bar, chart line, chart data, graphs bar
Скачать бесплатно! (2.67 Mb)
|
|

|
J4L-RChart for Php
Set of Php Classes for creating charts and graphs. It supports more than 18 types (linechart, piechart, barchart, radarchart, curves , gauges, 3D charts, Candlestick, areacharts ....) and combinations of them. The complete Php source code is included Ключевые слова:
chart, charts, php, graph, graph
Скачать бесплатно! (1.05 Mb)
|
|

|
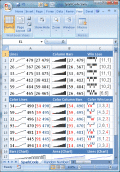
ConnectCode SparkCode Professional
SparkCode Professional is an add-in for Excel that lets you create sparklines - data intense, simple graphics that are as small as a cell - using TrueType fonts. It is a valuable tool for creating dashboard reports in Excel for visualizing data. Ключевые слова:
Sparklines, Excel Dashboard, Business Intelligence, Excel Dashboards, Business Intelligence
Скачать бесплатно! (1.21 Mb)
|
|

|
TeeChart JS
JavaScript/HTML5 charting library that plots graphs to all compatible browsers in native JavaScript format using the HTML5 Canvas element. Ключевые слова:
html5, javascript, javascript charting, js chart, jscript
Скачать бесплатно! (3.28 Mb)
|
|

|
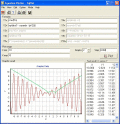
Equation Plotter - EqPlot
Graph plotter program plots 2D graphs from complex equations. The application comprises algebraic, trigonometric, hyperbolic and transcendental functions. EqPlot can be used to verify the results of nonlinear regression analysis program. Ключевые слова:
equation, graphing, graph, plotter, eqplot
Скачать бесплатно! (3.17 Mb)
|
|

|
Graph Digitizer Scout
Graph Digitizer Scout automatically converts hard-copy graphs, oscillograms, charts, plots,
into X,Y. Different recognition methods including manual correction mode. Data can be exported to Excel, CSV format and other applications. Ключевые слова:
digitize, x, y, data, convert
Скачать бесплатно! (5.19 Mb)
|
|
Страница: 1
| 2
| 3 | 4
| 5
|
|
|
|
