|

|
Virto SharePoint Gantt View
Light and easy-to-use tool for viewing SharePoint tasks as a Gantt Chart. With the component a SharePoint user can have all his tasks and subtasks in a single view, easily create and complete tasks, assign resources, edit time frames and percentage. Ключевые слова:
SharePoint, web part, silverlight, gantt, task
Скачать бесплатно! (1.97 Mb)
|
|
|
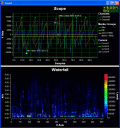
PlotLab VCL
Delphi/C++ Builder VCL/FMX components library for very easy and fast Data Visualization. Allows very fast display in a Plot/Scope/Chart or Waterfall form. Great for FFT or Histogram Visualization! Free for non-commercial use. Ключевые слова:
Chart, Scope, Plot, Waterfall, Plotting
Скачать бесплатно! (32 Mb)
|
|
|
TeeChart for Java
Java Charting components Library shipping with 100% sourcecode included. It offers 50+ Chart styles, 30+ financial and statistical indicators. Supports Swing, SWT, Android and major Java IDEs and Editors. Ключевые слова:
java charting library, java chart api, java graph and visualization library, gauges, charts java beans
Скачать бесплатно! (32 Mb)
|
|

|
Virto JQuery Charts for SharePoint
Virto Charts is a jQuery-based control for creating plots, graphs and charts in Microsoft SharePoint. Virto component produces beautiful line, bar and pie charts with many features. Ключевые слова:
sharepoint, web part, chart, graph, plot
Скачать бесплатно! (1.01 Mb)
|
|
|
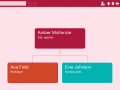
GetOrgChart
A JavaScript library for building interactive flow charts, specifically tailored for displaying a company's organizational chart Ключевые слова:
orgchart, orgcanizational chart, orgchart html
Скачать бесплатно! (615 Kb)
|
|

|
FusionCharts for VB
FusionCharts for VB is a charting component for Microsoft Visual Basic 6.0. It allows you to render interactive and animated charts in your Visual Basic applications. It has the ability to render over 40 chart types spanning both 2D and 3D charts. Ключевые слова:
vb charting control, vb charting component, visual basic charting, vb visualization component, vb charts
Скачать бесплатно! (9.95 Mb)
|
|

|
Nevron Chart for SSRS
Nevron Chart for SSRS (market's leader for its visual style, effects,layout features and data integration) is a solution,designed to provide an easy and powerful way to implement state-of-art charts in any report, modified with MS Reporting Services. Ключевые слова:
Reporting Services, Chart, SQL Reporting Services, SQL, Dashboards
Скачать бесплатно! (32 Mb)
|
|

|
TeeChart Pro VCL / CLX
100% VCL native charting component with optional 100% SourceCode included.Support for Delphi up to 2005, C++Builder and Kylix. It provides of properties and methods to create hundreds of chart styles in 2D,3D and OpenGL. For Windows and the Web. Ключевые слова:
delphi charting, delphi chart component, delphi 2010 chart, chart and graph, chart and gauges
Скачать бесплатно! (32 Mb)
|
|

|
Super 2d/3d Graph Library
Award-winning .NET library for 2d and 3d chart drawing. Can be used either as a Winform control or in ASP.NET web pages. Professional Edition only 99?‚¬. Royalty-free! Ключевые слова:
svg chart, PDF chart, scalable vector graphics, data visualization, data charts
Скачать бесплатно! (1.23 Mb)
|
|
|
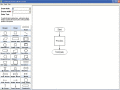
1888 Quick Flow Chart Creator
Free flow chart creator with all the symbols required in flow chart. Draw flow charts and diagrams quickly for your presentation, documents, etc. Use ready-made symbols; set draw width, eraser width, font size, and colors of diagrams and text. Ключевые слова:
flow chart, flow charts, create flow chart, free flow chart software, flow chart software
Скачать бесплатно! (252 Kb)
|
|
Страница: 1
| 2
| 3
| 4 | 5
|
|
|
|
