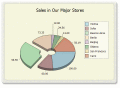
|
|
TeeChart for PHP Open Source
Object-Oriented Charting component library completely written in PHP and ready to be used in any PHP scripts. It includes full source code meaning that no loaders have to be used in order to create a Graph on servers. Ключевые слова:
php open source chart, chart graph for php, phped, zend studio, delphi for php
Скачать бесплатно! (6.55 Mb)
|
|
|
Nevron Vision for .NET
.NET Vision is a professional suite for creating state-of-art data presentation and map applications with spectacular data visualization capabilities. It delivers powerful Charting and Diagramming components for Windows Forms and ASP.NET. Ключевые слова:
.net diagram, .net chart, block diagram, map diagrams, ESRI import
Скачать бесплатно! (32 Mb)
|
|
|
TeeChart for Java
Java Charting components Library shipping with 100% sourcecode included. It offers 50+ Chart styles, 30+ financial and statistical indicators. Supports Swing, SWT, Android and major Java IDEs and Editors. Ключевые слова:
java charting library, java chart api, java graph and visualization library, gauges, charts java beans
Скачать бесплатно! (32 Mb)
|
|
|
Stock Charting Software
Financial market charting tool offer market indicators moving averages bollinger bands stochastic oscillators price channels volatility MACD momentum open multiple chart documents maintain predefined securities lists apply trading strategy Ключевые слова:
Stock, financial, market, database, security
Скачать бесплатно! (4.44 Mb)
|
|
|
J4L-RChart
Java charting package. It can be used as bean, applet , servlet, in JSP pages, in PDF files, in mobile devices (Android , J2ME), with SWT... It supports more than 18 different chart types like piecharts, linecharts, barcharts, areacharts and more. Ключевые слова:
java, chart, charts, applet, servlet
Скачать бесплатно! (2.1 Mb)
|
|
|
MindFusion.Charting for WinForms
Easy to use .NET gauge and charting controls for Windows Forms applications. The package includes Graph, Line, Area, Bar, Radar and Pie charts and Oval and Linear gauges. Each of them can be fully customized via the hundreds properties and methods. Ключевые слова:
pie, line, area, bar, radar
Скачать бесплатно! (6.29 Mb)
|
|
|
MindFusion.Charting for WPF
Easy to use .NET gauge and charting controls for WPF applications. The package includes Graph, Line, Area, Bar, Radar and Pie chart components and Oval and Linear gauges. Each of them can be fully customized via the hundreds properties and methods. Ключевые слова:
pie, line, area, bar, chart
Скачать бесплатно! (9.73 Mb)
|
|
|
TickInvest
Stock charting and technical analysis software with a user-friendly interface targeted for stock investors and realtime traders. Supported dataproviders are Yahoo and Interactive Brokers. Realtimecharts, Indicators, Easy to use script language... Ключевые слова:
stock charting, stock market, stock market, stock charts, realtime charts
Скачать бесплатно! (32 Mb)
|
|
|
TickInvest Free Edition
Stock charting and technical analysis software with a user-friendly interface targeted for stock investors and realtime traders. Supported dataproviders are Yahoo and Interactive Brokers. Realtimecharts, Indicators, Easy to use script language... Ключевые слова:
stock charting, stock market, stock market, stock charts, realtime charts
Скачать бесплатно! (27.8 Mb)
|
|
|
MasterChart
Easy to use .NET charting controls for ASP.NET and Windows Forms applications. The package includes Graph, Line, Area, Bar and Pie Chart components. Each of them can be fully customized via the hundreds properties and methods. Royalty free. Ключевые слова:
pie, line, area, bar, chart
Скачать бесплатно! (8.39 Mb)
|
|
Страница: 1
| 2
| 3
| 4 | 5
|
|
|
|