|

|
Solid Signals
Solid Signals gives you signals during trading hours to buy/sell scrips or commodities with stop loss and target levels. With very good accuracy it helps you to take a call on the market. Technical Analysis based signals. Ключевые слова:
Solid Signals, charting software, charting, stock levels, buy and sell signals
Скачать бесплатно! (441 Kb)
|
|

|
FusionCharts for Dreamweaver (Designer)
FusionCharts for Dreamweaver (Designer Edition) is a Charting Extension that can be used to render interactive & animated web charts for online applications and presentations. FusionCharts for DW is a cross-platform charting solution. Ключевые слова:
web charts, Flash Charts, Charting, data visualization, Data plotting
Скачать бесплатно! (4.84 Mb)
|
|
|
FusionCharts for Dreamweaver - Designer Edition
FusionCharts for Dreamweaver (Designer Edition) is a Charting Extension that can be used to render interactive & animated web charts for online applications and presentations. FusionCharts for DW is a cross-platform charting solution. Ключевые слова:
web charts, Flash Charts, Charting, data visualization, Data plotting
Скачать бесплатно! (4.84 Mb)
|
|

|
TeeChart for PHP Open Source
Object-Oriented Charting component library completely written in PHP and ready to be used in any PHP scripts. It includes full source code meaning that no loaders have to be used in order to create a Graph on servers. Ключевые слова:
php open source chart, chart graph for php, phped, zend studio, delphi for php
Скачать бесплатно! (6.55 Mb)
|
|
|
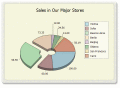
MindFusion.Charting for WinForms
Easy to use .NET gauge and charting controls for Windows Forms applications. The package includes Graph, Line, Area, Bar, Radar and Pie charts and Oval and Linear gauges. Each of them can be fully customized via the hundreds properties and methods. Ключевые слова:
pie, line, area, bar, radar
Скачать бесплатно! (6.29 Mb)
|
|

|
MindFusion.Charting for WPF
Easy to use .NET gauge and charting controls for WPF applications. The package includes Graph, Line, Area, Bar, Radar and Pie chart components and Oval and Linear gauges. Each of them can be fully customized via the hundreds properties and methods. Ключевые слова:
pie, line, area, bar, chart
Скачать бесплатно! (9.73 Mb)
|
|
|
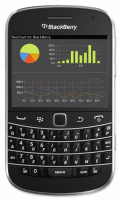
TeeChart Java for BlackBerry
Charting Library offers over 50 Chart styles including pie, line, points, bar, area, gauges and maps and 2D,3D formats, 38 mathematical functions and a full set of Chart tools components for additional functionality.Built in 100% native Java code. Ключевые слова:
chart, charting, blackberry, mobile, jde
Скачать бесплатно! (8.22 Mb)
|
|
|
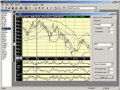
Ashkon Stock Watch
Ashkon Stock Watch is an advanced charting software for financial market information. It allows to display several technical indicators for a single security on the same chart, open multiple chart documents and test investment strategies. Ключевые слова:
stock, market, financial, chart, charting
Скачать бесплатно! (4.45 Mb)
|
|

|
Nevron 3DChart for ActiveX
Nevron 3DChart is a powerful charting component used to create stunning 3D and 2D charts for client applications and web pages using COM or .NET technologies. 3DChart uses the OpenGL 3D graphics engine to produce state-of-art 2D and 3D charts. Ключевые слова:
3D, chart, ActiveX, controls, shareware
Скачать бесплатно! (28.12 Mb)
|
|
|
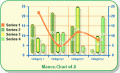
Manco.Chart for .NET
Manco.Chart for .NET is a powerful charting component used to create attractive 3D and 2D charts for desktop applications and web pages using .NET technologies. 3D charting uses the OpenGL graphics engine to create sophisticated 3D charts and graphs. Ключевые слова:
.NET, chart, control, charting, Windows
Скачать бесплатно! (6.46 Mb)
|
|
Страница: 1
| 2
| 3
| 4
| 5
|
|
|
|
