|

|
Just Watching
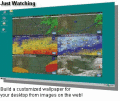
Imagine that you could continuously monitor multiple online images without having to open your browser! Use Just Watching to build a custom wallpaper that can display web cams, stock charts, weather maps and home security cams right on your desktop! Ключевые слова:
just watching, just, web cams, web images, cams
Скачать бесплатно! (1.46 Mb)
|
|

|
Graph Converter Lite
Данная простая в освоении программа даст Вам возможность перевести все имеющиеся на бумаге графики и диаграммы в электронный вид. Просто отсканируйте график, откройте изображение в прграмме GCL, произведите калибровку. Ключевые слова:
Graph, Converter
Скачать бесплатно! (1.92 Mb)
|
|

|
Active Graphs and Charts
Add Powerful reporting features to your Web / Intranet pages and applications. With the advanced graphing functionality you will be quickly adding impressive and dynamic charting capabilities bringing your data alive ! Ключевые слова:
graph, chart, graph and chart, graphing, charting
Скачать бесплатно! (270 Kb)
|
|

|
SharpShooter Diagrams
SharpShooter Diagrams offers a unified designer for diagrams and flow charts building which can be integrated into Silverlight app. It includes 200 predesigned shapes that are complex objects with properties setting up their appearance and behavior. Ключевые слова:
flow charts, diagrams, silverlight diagrams, silverlight charts, silverlight shapes
Скачать бесплатно! (8.94 Mb)
|
|

|
WpfDiagram
The WpfDiagram component adds to applications the ability to create and present workflow, flowchart and process diagrams, database entity-relationship diagrams, organizational, hierarchy and relationship charts, network schemes, graphs and trees. Ключевые слова:
flow, flowchart, chart, diagram, workflow
Скачать бесплатно! (18.6 Mb)
|
|

|
Science Teacher's Helper
Science Teacher's Helper was designed with a single purpose in mind - to save you time when editing math, chemistry and physics in documents. You can easily add 1200 functions, graphs and charts of physical, chemical and math into MS WORD document. Ключевые слова:
teacher stuff, teacher tool, teacher helper, high school physics, science experiment
Скачать бесплатно! (818 Kb)
|
|

|
SharpShooter Dashboards
SharpShooter Dashboards is a pack of .NET components for complicated and intelligent digital dashboard creation. The package includes the component for hardware emulator creation and the component for interactive graphs and charts creation. Ключевые слова:
.net dashboards, asp.net dashboards, data visualization
Скачать бесплатно! (32 Mb)
|
|

|
JavaScript Diagram
JsDiagram is a flow diagramming JavaScript / HTML 5 Canvas library for web applications. It helps you create and present flowcharts, workflow and process diagrams, organizational and relationship charts, network drawings, graphs and trees. Ключевые слова:
flow, flowchart, chart, diagram, workflow
Скачать бесплатно! (11.27 Mb)
|
|

|
Edraw Organizational Chart
Edraw is a new organization chart drawing software, which creates organisation charts and business charts with minimum time loss for you. Support basic flowcharts, organizational charts, business charts, hr diagram and work flowchart. Ключевые слова:
Organizational Charts, Organization Charts, Organizational Chart Software, Organization Chart Software, Org Charts
Скачать бесплатно! (19.56 Mb)
|
|

|
MindFusion.Diagramming for JavaScript
JsDiagram is a flow diagramming JavaScript / HTML 5 Canvas library for web applications. It helps you create and present flowcharts, workflow and process diagrams, organizational and relationship charts, network drawings, graphs and trees. Ключевые слова:
flow, flowchart, chart, diagram, workflow
Скачать бесплатно! (8.51 Mb)
|
|
Страница: 1
| 2
| 3 | 4
| 5
|
|
|
|
