|
|
CsXGraph
ActiveX control to draw 2D pie charts, bar charts and line graphs. Display the graphs, export to file (GIF, PNG, BMP) or data stream or copy to the clipboard. Properties allow full control over colours and fonts. Free trial. Ключевые слова:
ocx, activex, component, control, graph
Скачать бесплатно! (991 Kb)
|
|

|
.Net Chart Control
Chart Control .NET is the perfect solution to add the most advanced, feature rich charts to Windows Forms and ASP.NET applications. Over 40 2D/3D charts are available. Uses OpenGL (3D) and GDI+ (2D) for fast-rendering charts. Ключевые слова:
.Net chart, chart control, .Net chart control, .Net control, Control Chart .net
Скачать бесплатно! (4.85 Mb)
|
|

|
Chart Tools for Excel
With this Excel add-in you will be able to: Copy and paste format from a chart to another one, Resize and save charts, Add images, Add and move labels, Configure quickly the most common tasks in your spreadsheets and More... Ключевые слова:
chart tools, chart tools for excel, excel charts tools, excel graphics, charts format
Скачать бесплатно! (2.49 Mb)
|
|

|
FusionCharts Free
FusionCharts Free helps you create free flash charts in your web applications. It supports a variety of chart types including bar, column, line, area, pie, doughnut (donut), combination, funnel, Gantt chart etc. Ключевые слова:
flash charts, flash chart, flash charting, flash graphs, flash graph
Скачать бесплатно! (4.22 Mb)
|
|

|
Mileage Charts for Europe
European Mileage Charts and Tables stored as Excel 2007 workbooks, including travel times and distances for both the fastest and shortest routes. Includes two pan-European table; plus tables for 24 European countries. Ключевые слова:
mileage charts, mileage tables, travel time, road distances, cities
Скачать бесплатно! (32 Mb)
|
|
|
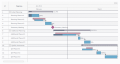
AnyGantt JS Gantt Charts
AnyGantt is a flexible, cross-platform and cross-browser JavaScript charting library that allows you to easily build smart HTML5 Gantt Charts and utilize the power of animation and ultimate interactivity to facilitate project and resource management. Ключевые слова:
anygantt, gantt charts, javascript charts, ajax charts, html5 charts
Скачать бесплатно! (17.81 Mb)
|
|
|
RFFlow
RFFlow is a drawing tool that allows you to quickly and easily draw flowcharts, organization charts, audit charts, cause-effect (fishbone) diagrams, PERT charts, Gantt charts, database definitions, electronic schematics, and more. Ключевые слова:
flowchart, flow chart, organization chart, graphics, diagram software
Скачать бесплатно! (5.49 Mb)
|
|

|
Animated Chart Pro
XML Flash charts allows your to display live data on your website. Animated Chart Pro lets to create and customize XML-driven dynamic flash chart and publish it to website. Area, Bar, Bubble, Column, Doughnut, Line, Pie, Scatter, Radar, Stock charts. Ключевые слова:
xml flash chart, dynamic flash chart, chart, graph, flash chart
Скачать бесплатно! (2.67 Mb)
|
|
|
Magico Chart
Magico chart is a tool to make especial chart. Different from traditional charts, this software can make chats will icon of the objects to be analysed. These lively statistical charts can bring a beam of light in your business report. Ключевые слова:
statistical chart, chart, data analysis
Скачать бесплатно! (1.14 Mb)
|
|

|
RFFlow Flowchart Software
RFFlow is a drawing tool that allows you to quickly and easily draw flowcharts, organization charts, audit charts, cause-effect (fishbone) diagrams, PERT charts, Gantt charts, database definitions, electronic schematics, and more. Ключевые слова:
flowchart, flow chart, organization chart, graphics, diagram software
Скачать бесплатно! (5.26 Mb)
|
|
Страница: 1
| 2
| 3 | 4
| 5
|
|
|
|
