|

|
SimpleTruss
Draw and automatically calculate simple trusses. Good for students, playing or simply checking of an idea. Ключевые слова:
simpletruss, bridge, education, truss bridge, visualization
Скачать бесплатно! (1.07 Mb)
|
|

|
VisProtSSS
In the Age of Molecular Biology look at the most intrigue molecules - Proteins, DNA, if you have a rest. You can use Screen Saver VisProtSSS to look at the proteins in stereo for the education purposes, as a hobby, with curiosity or simply for a fun. Ключевые слова:
screen saver, screensaver, protein visualization, protein vizualizer, protein viewer
Скачать бесплатно! (2.39 Mb)
|
|

|
LightningChart Ultimate SDK
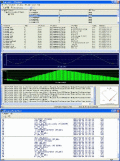
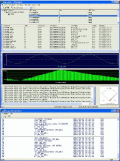
LightningChart Ultimate SDK is the fastest 2D and 3D measurement, engineering and research data visualization SDK for .NET and Windows. LightningChart Ultimate is entirely GPU accelerated and performance optimized. Ключевые слова:
3D, surface, chart, fastest, sample
Скачать бесплатно! (19.07 Mb)
|
|

|
AnyGantt JS Gantt Charts, Dashboards
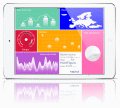
AnyGantt is a flexible, cross-platform and cross-browser JavaScript based data-visualization library that allows you to utilize power of animation and ultimate interactivity, and is an ideal tool to build complex and informative HTML5 Gantt charts. Ключевые слова:
anygantt, charts, javascript charts, gantt charts, date time charts
Скачать бесплатно! (992 Kb)
|
|

|
Data Visualization
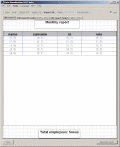
Free (for commercial and non commercial use) generic cross platform and cross db reporting tool. Supports many dbs and many export formats like PDF, RTF, CSV, XML, HTML etc. Ключевые слова:
import, export, data base, db, Oracle
Скачать бесплатно! (14.84 Mb)
|
|

|
Business Analysis Tool Desktop
"Инструмент для бизнес-анализа" является приложением для аналитической отчетности и визуализации данных. Вы можете анализировать Ваши данные с помощью сводных таблиц, графиков, тримапов и динамических скеттер-диаграмм. См. сайт компании BIT Impulse. Ключевые слова:
business intelligence, data analysis, OLAP, reporting, visualization
Скачать бесплатно! (29.09 Mb)
|
|

|
TeeChart NET for Xamarin.iOS
TeeChart Charting component for Xamarin.iOS offers a wide range of common and specialized chart types, gauges and maps with customizable tools for data visualization in the mobile applications. Ключевые слова:
Chart Component, .NET for Xamarin.IOS, Chart for Xamarin iOS, .NET Windows Phone chart, Mobile chart
Скачать бесплатно! (20.56 Mb)
|
|

|
OPCAdapter Enhanced
OPC client, DA 3.0, 2.05, 1.0 with TCP/IP tunneling to local or networked application over computer domains and operating system platforms, trending, displaying, own activity logging. OPC Client groups and visualization are saved to XML file. Ключевые слова:
OPC, Client, HMI, monitoring, trending
Скачать бесплатно! (4.72 Mb)
|
|

|
OPCAdapter Basic
OPC client, DA 3.0, 2.05, 1.0 with TCP/IP tunneling to local or networked application over computer domains and operating system platforms, trending, displaying, own activity logging. OPC Client groups and visualization are saved to XML file. Ключевые слова:
OPC, Client, HMI, monitoring, trending
Скачать бесплатно! (4.1 Mb)
|
|

|
VisLog
VisLog is a robust and powerful software, designed for visualizing geotechnical/geological borehole logs and automatically drawing soil profiles. more than 30 soil types are supported and input data can be imported either from SMTP or gINT software. Ключевые слова:
borehole log, log visualization, soil mechanics, gINT, gINT log
Скачать бесплатно! (9.05 Mb)
|
|
Страница: 1
| 2
| 3
| 4 | 5
|
|
|
|
