|

|
Animated Chart
Flash charts made easy. Software for generating animated interactive Flash charts and graphs for publishing to websites. Making graphs with Animated Chart is simple and quick and doesn't require any special knowledge of Flash or HTML. Ключевые слова:
flash chart, chart bar, chart line, chart data, graphs bar
Скачать бесплатно! (2.67 Mb)
|
|

|
Active Graphs and Charts
Add Powerful reporting features to your Web / Intranet pages and applications. With the advanced graphing functionality you will be quickly adding impressive and dynamic charting capabilities bringing your data alive ! Ключевые слова:
graph, chart, graph and chart, graphing, charting
Скачать бесплатно! (270 Kb)
|
|

|
Grab It
Digitize graphs and charts quickly with our Excel based spreadsheet software. Distance measurement and angle determination capability also. Log, linear, date and time scales. Free demo! Ключевые слова:
digitize, graphic tablet, spreadsheet, excel, graph
Скачать бесплатно! (840 Kb)
|
|

|
Grab It! XP
Digitize graphs and charts quickly with our Excel based spreadsheet software. Log, linear, date and time scales, distance measurement and angle determination capability also. Free upgrades forever! Ключевые слова:
digitize, graph, chart, excel, math
Скачать бесплатно! (840 Kb)
|
|

|
ConnectCode SparkCode Professional
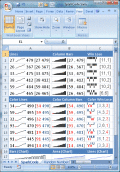
SparkCode Professional is an add-in for Excel that lets you create sparklines - data intense, simple graphics that are as small as a cell - using TrueType fonts. It is a valuable tool for creating dashboard reports in Excel for visualizing data. Ключевые слова:
Sparklines, Excel Dashboard, Business Intelligence, Excel Dashboards, Business Intelligence
Скачать бесплатно! (1.21 Mb)
|
|

|
Virto JQuery Charts for SharePoint
Virto Charts is a jQuery-based control for creating plots, graphs and charts in Microsoft SharePoint. Virto component produces beautiful line, bar and pie charts with many features. Ключевые слова:
sharepoint, web part, chart, graph, plot
Скачать бесплатно! (1.01 Mb)
|
|

|
Insert Lines In Multiple Text Files Software
Insert line(s) in multiple text files at once. Insert line(s) as the first line, last line or before/after user-specified location. Ключевые слова:
inserting, insertion, line, txt, first
Скачать бесплатно! (756 Kb)
|
|

|
Archim
Archim is a program for drawing the graphs of all kinds of functions. You can define a graph explicitly and parametrically, in polar and spherical coordinates, on a plane and in space (surface). Archim will be useful for teachers and students. Ключевые слова:
graphs, function, chart, plot, 3d graph
Скачать бесплатно! (469 Kb)
|
|

|
Function Grapher For Academic
Function Grapher is graph maker to create 2D, 2.5D, 3D and 4D function graphs, animations and table graphs. Ключевые слова:
function grapher, graph maker, graph function, graph functions
Скачать бесплатно! (3.31 Mb)
|
|

|
FlyCharts Flash Chart Component
FlyCharts is a chart flash component. It is a set of Adobe Flash (SWF) files that gives an outstanding possibility to visualize data. FlyCharts help create compact, interactive and good-looking flash graphs and charts for web applications. Ключевые слова:
flycharts, chart, flash, flash component, graphs
Скачать бесплатно! (452 Kb)
|
|
Страница: 1
| 2 | 3
| 4
| 5
|
|
|
|
