|

|
Network Traffic Monitor Pro
Provides information about the amount of internet traffic made by each application on your computer.Detailed graphs show live upload and download rates, current connections and historical reports on bandwidth usage for every application. Ключевые слова:
network traffic monitor, network applications, traffic monitor, network packets, ports
Скачать бесплатно! (1.18 Mb)
|
|

|
FlowChart.NET
The FlowChart.NET component adds to applications the ability to create and present workflow, flowchart and process diagrams, database entity-relationship diagrams, organizational, hierarchy and relationship charts, network schemes, graphs and trees. Ключевые слова:
flow, flowchart, chart, diagram, workflow
Скачать бесплатно! (22.84 Mb)
|
|

|
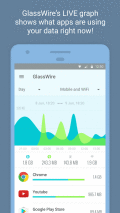
GlassWire Data Usage Security
Instantly see which apps are wasting your data, acting suspiciously, slowing your phones Internet speed, or causing you to go over your carrier data limits. GlassWire makes it easy to keep track of your mobile carrier data usage and WiFi Internet. Ключевые слова:
GlassWire, Data Usage, Security, Privacy, Data Manager
Скачать бесплатно! (7.71 Mb)
|
|

|
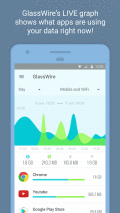
GlassWire Data Usage Monitor
Instantly see which apps are wasting your data, acting suspiciously, slowing your phones Internet speed, or causing you to go over your carrier data limits. GlassWire makes it easy to keep track of your mobile carrier data usage and WiFi Internet. Ключевые слова:
GlassWire, Data Usage, Security, Privacy, Data Manager
Скачать бесплатно! (7.71 Mb)
|
|

|
Atlantis Schema Surf
Atlantis Schema Surf is our SQL dependency & live entity ER diagram tool - it is a free animated graphing tool which allows you to easily visualize the dependencies between the objects in your SQL Server databases in a live entity ER diagram. Ключевые слова:
SQL Server, Schema Navigation, Schema Exploration, Schema Visualization, Dependency Visualization
Скачать бесплатно! (7.38 Mb)
|
|

|
Network+ N10-006 Exam Simulator
The features of Network+ Exam Simulator include - Integrated Test Engine, 475+ questions, Support for different question types, Flash card information and Detailed Help File. Ключевые слова:
Network+ exam simulator, Network+ practice questions, CompTIA Network+, Network+, exam simulator
Скачать бесплатно! (3.3 Mb)
|
|

|
Exam Simulator for Network+
The features of Network+ Exam Simulator include - Integrated Test Engine, 300+ questions, Support for different question types, Flash card information and Detailed Help File. Ключевые слова:
Network+ exam simulator, CompTIA Network+, Network+ examsim, exam simulator, exam simulator for Network+
Скачать бесплатно! (10.25 Mb)
|
|

|
Speed Upp
Programmable metronome for training speed and precision on any musical instrument. It will guide you during scale exercises and chromatic drills by changing tempo according to clever pre-defined graph. Even better, you can define and save your own id Ключевые слова:
metronome, programmable, speed trainer, guitar, drums
Скачать бесплатно! (19.41 Mb)
|
|

|
Network+(N10-006) Exam Simulator
The features of NETWORK+ Exam Simulator include - Integrated Test Engine, 450+ questions, Support for different question types, Flash card information and Detailed Help File. Ключевые слова:
NETWORK+ exam simulator, CompTIA Network+, Network+ examsim, exam simulator, exam simulator for Network+
Скачать бесплатно! (6.77 Mb)
|
|

|
Pie Chart Graph Generator Software
Create pie charts based on numbers and their corresponding labels. Ключевые слова:
creating pie charts, graph, graphing, statistics, without excel
Скачать бесплатно! (754 Kb)
|
|
Страница: 1
| 2
| 3
| 4 | 5
|
|
|
|
