|

|
Chart ModelKit
Chart ModelKit – компонент графического отображения данных со встроенным дизайнером, обеспечивающим режим полного соответствия (WYSIWYG), и усовершенствованной моделью привязки данных. Библиотека содержит набор стандартных элементов и типов графиков. Ключевые слова:
chart net, net charting, chart component, charting component, pie chart
Скачать бесплатно! (32 Mb)
|
|

|
OrgChart JS
A JavaScript library for building interactive Org-Charts, specifically tailored for displaying a company's organizational structure Ключевые слова:
orgchart js, org chart, organizational chart, org-chart html, tree js
Скачать бесплатно! (70 Kb)
|
|

|
Xceed Chart for ASP.NET
Create spectacular charts in ASP.NET projects without breaking the bank. ASP.NET support includes streaming, image maps, server-side events, temp file cleanup and much more. Get all the chart types and features you need at a down-to-earth price. Ключевые слова:
chart, graph, graphics, .NET, ASP.NET
Скачать бесплатно! (32 Mb)
|
|

|
Animated Chart
Flash charts made easy. Software for generating animated interactive Flash charts and graphs for publishing to websites. Making graphs with Animated Chart is simple and quick and doesn't require any special knowledge of Flash or HTML. Ключевые слова:
flash chart, chart bar, chart line, chart data, graphs bar
Скачать бесплатно! (2.67 Mb)
|
|

|
Nevron Vision for .NET
.NET Vision is a professional suite for creating state-of-art data presentation and map applications with spectacular data visualization capabilities. It delivers powerful Charting and Diagramming components for Windows Forms and ASP.NET. Ключевые слова:
.net diagram, .net chart, block diagram, map diagrams, ESRI import
Скачать бесплатно! (32 Mb)
|
|

|
StockChartX
StockChartX is a component that can import raw stock data, display it graphically, embed chart objects, and save/load in XML file format. Use StockChartX as your essential front-end data analysis tool for developing interactive financial apps. Ключевые слова:
finace, chart, financial chart, stock chart, chart
Скачать бесплатно! (1024 Kb)
|
|

|
Virto SharePoint Gantt View
Light and easy-to-use tool for viewing SharePoint tasks as a Gantt Chart. With the component a SharePoint user can have all his tasks and subtasks in a single view, easily create and complete tasks, assign resources, edit time frames and percentage. Ключевые слова:
SharePoint, web part, silverlight, gantt, task
Скачать бесплатно! (1.97 Mb)
|
|

|
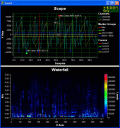
PlotLab VCL
Delphi/C++ Builder VCL/FMX components library for very easy and fast Data Visualization. Allows very fast display in a Plot/Scope/Chart or Waterfall form. Great for FFT or Histogram Visualization! Free for non-commercial use. Ключевые слова:
Chart, Scope, Plot, Waterfall, Plotting
Скачать бесплатно! (32 Mb)
|
|

|
TeeChart for Java
Java Charting components Library shipping with 100% sourcecode included. It offers 50+ Chart styles, 30+ financial and statistical indicators. Supports Swing, SWT, Android and major Java IDEs and Editors. Ключевые слова:
java charting library, java chart api, java graph and visualization library, gauges, charts java beans
Скачать бесплатно! (32 Mb)
|
|

|
Virto JQuery Charts for SharePoint
Virto Charts is a jQuery-based control for creating plots, graphs and charts in Microsoft SharePoint. Virto component produces beautiful line, bar and pie charts with many features. Ключевые слова:
sharepoint, web part, chart, graph, plot
Скачать бесплатно! (1.01 Mb)
|
|
Страница: 1
| 2
| 3
| 4 | 5
|
|
|
|
