|
|
ZWCAD Viewer
ZWCAD Viewer runs on different operating systems such as Windows (32-bit & 64-bit), Mac OS and Linux. With ZWCAD Viewer, drawings can be viewed in all kinds of frequently used file formats like dwg, dwf, dwfx, dxf and dwt. Ключевые слова:
ZWCAD, DWG CAD, DWG Viewer, AutoCAD free download, free download CAD
Скачать бесплатно! (32 Mb)
|
|
|
Google Maps Plot Multiple Locations Software
Map several addresses on one Google Map layout. Save results as image files. Ключевые слова:
locations, plotting, plotter, plotable, address
Скачать бесплатно! (811 Kb)
|
|
|
Excel Graph Multiple Equations Software
Plot multiple functions in MS Excel. Excel 2000 or higher required. Ключевые слова:
graphing, linear, excel2007, quadratic, calculator
Скачать бесплатно! (769 Kb)
|
|
|
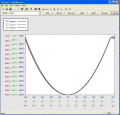
Infinitiscope
Infinitiscope is a graphical display tool that has special characteristics for numerical data display. Ключевые слова:
graph, plotting, visualization, scientific, research
Скачать бесплатно! (3.34 Mb)
|
|
|
CalculationLaboratory
CalculationLaboratory - математическая программа, которая может работать со скриптами. Имеется поддержка очень больших чисел. Имеется также построитель графиков. Ключевые слова:
math, script, calculation, addition, multiplication
Скачать бесплатно! (2.88 Mb)
|
|

|
Excel Extract Data From Charts or Graph Software
Extract data from one or more charts in MS Excel. Save results as text files. Excel 2000 or higher required. Ключевые слова:
charting, graphing, plot, changing, change
Скачать бесплатно! (755 Kb)
|
|

|
CrazyMath
Allows you to enter sequences of expressions as you would write them on paper. Ключевые слова:
calculator, expression, plot, algebra, trigonometry
Скачать бесплатно! (1.44 Mb)
|
|
|
Infinitiscope COM Standard
Infinitiscope COM is a graphical display library that has special characteristics for data display. Ключевые слова:
graph, plotting, visualization, scientific, research
Скачать бесплатно! (3.16 Mb)
|
|

|
Grapholic
Grapholic is an extremely useful tool for maximizing data visualization. You can convert your raw data into meaningful Graphs in just a few clicks. The simple steps you follow are Import, plot, modify and export to get your data in graphical form. Ключевые слова:
Graph making software, graphing solution, plotting charts, creating bar graphs, line graphs
Скачать бесплатно! (8.12 Mb)
|
|

|
Browse Maxima
Maxima is a symbolic computation program. Ключевые слова:
Lisp, lisps, Bourne shell, make, Plotting
Скачать бесплатно! (22.19 Mb)
|
|
Страница: 1
| 2 | 3
| 4
| 5
|
|
|
|
