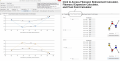
Скачать свежий бесплатный софт
chart technical analysis...
technical
technical editors
technical support
technical solutions
technical charts
technical assistance
technical graphics
technical illustration
technical writing
technical documentation
technical calculations
Инструменты Разработчика :: Компоненты и Библиотеки
Вёб Разработка :: Javascript и Java
Бизнес :: Финансы
Chart control creates 40 2D/3D charts.

.Net Chart Control


Chart Control .NET is the perfect solution to add the most advanced, feature rich charts to Windows Forms and ASP.NET applications. Over 40 2D/3D charts are available. Uses OpenGL (3D) and GDI+ (2D) for fast-rendering charts.

Ключевые слова:
.Net chart, chart control, .Net chart control, .Net control, Control Chart .net

Скачать бесплатно! (4.85 Mb)


ActiveX Charting Component Library

TeeChart Pro ActiveX


TeeChart ActiveX charting component offers hundreds of Graph styles in 2D and 3D, 56 mathematical and statistical Functions for you to choose from together with an unlimited number of axes and 14 toolbox components. For Windows and Web applications.

Ключевые слова:
ActiveX charting component, ActiveX Chart, Chart for COM, IIS, ASP

Скачать бесплатно! (32 Mb)


Full-featured HTML5 chart component

JavaScript Chart Standard


Shield UI Chart is feature rich and facilitates the creation of visually impressive charts and sharp graphics. The Chart control has many built-in features, which cover many of the common data visualization scenarios.

Ключевые слова:
javascript chart, html5 chart, asp.net, mvc, apache wicket

Скачать бесплатно! (1.8 Mb)


Professional .NET Chart component

Nevron Chart for .NET


Nevron Chart for .NET is a professional charting component for .NET, featuring numerous business, scientific and financial charting types, gauges, VS design time support, AJAX support, built-in toolbar, flexible axes, and much more.

Ключевые слова:
bar graph, charting, .net chart, .net gauge, bar chart

Скачать бесплатно! (32 Mb)


.Net Window Form Chart Components

Dragonfly Chart .Net


.Net Window Form Chart Components can be widely applied in many industry HMI applications, financial and insurance applications, scientific research and analytical applications, development-simulation applications

Ключевые слова:
Windows, Form, Control, .Net, HMI

Скачать бесплатно! (3.55 Mb)


Charting Component for Delphi VCL & FMX

TeeChart Pro VCL / FMX


TeeChart VCL/FMX charting components library offers full set of Graph styles in 2D and 3D for data visualization, 50+ financial and statistical indicators for you to choose from together with an unlimited number of axes and 30 Palette components.

Ключевые слова:
Chart Component, VCL Chart, Delphi Chart, Data Visualization, Charting Component

Скачать бесплатно! (20.48 Mb)


Manco.Chart for CF adds charts to the .NET CF

Manco.Chart for Compact Framework


Manco.Chart for Compact Framework is the perfect solution to add the most advanced, feature rich charts to the applications written for .NET Compact Framework platform (Windows Mobile).

Ключевые слова:
chart, control, .net, compact, framework

Скачать бесплатно! (1.19 Mb)


stock charting software implements Mano Stick

Path2Profit


stock analysis charting software implements Mano Stick - the advanced chart type which is able to show volume in addition to the price data. drawing objects such as lines, trading, news, arrows, text can also be stored. light weight java application.

Ключевые слова:
stock chart, candle stick, technical analysis, advanced chart, financial news

Скачать бесплатно! (1.1 Mb)


Open Source Charting library for PHP

TeeChart for PHP Open Source


Object-Oriented Charting component library completely written in PHP and ready to be used in any PHP scripts. It includes full source code meaning that no loaders have to be used in order to create a Graph on servers.

Ключевые слова:
php open source chart, chart graph for php, phped, zend studio, delphi for php

Скачать бесплатно! (6.55 Mb)


Chart Patterns Tutorial with Fibonacci Ratio

Chart Patterns Tutorial


Chart Patterns Tutorial is a software for investors and traders. This tool can help you to learn Fibonacci Price Pattern, Harmonic Pattern, and Elliott Wave. In addition, this tool provides Fibonacci Ratio Calculator and Pivot Point Calculator.

Ключевые слова:
Chart Patterns, Fibonacci Analysis, Harmonic Pattern, Elliott Wave, X3 Chart Pattern

Скачать бесплатно! (891 Kb)


Страница: 1 | 2 | 3 | 4 | 5
Категории:
Свежий софт:
Наши проекты: