|

|
RFFlow
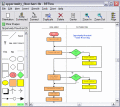
RFFlow is a drawing tool that allows you to quickly and easily draw flowcharts, organization charts, audit charts, cause-effect (fishbone) diagrams, PERT charts, Gantt charts, database definitions, electronic schematics, and more. Ключевые слова:
flowchart, flow chart, organization chart, graphics, diagram software
Скачать бесплатно! (5.49 Mb)
|
|

|
RFFlow Flowchart Software
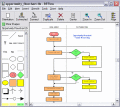
RFFlow is a drawing tool that allows you to quickly and easily draw flowcharts, organization charts, audit charts, cause-effect (fishbone) diagrams, PERT charts, Gantt charts, database definitions, electronic schematics, and more. Ключевые слова:
flowchart, flow chart, organization chart, graphics, diagram software
Скачать бесплатно! (5.26 Mb)
|
|

|
Collabion Charts for SharePoint
Collabion Charts for SharePoint lets you create stunning, Sharepoint-driven dashboards in SharePoint in just 15 minutes, without writing a single line of code. Ключевые слова:
sharepoint chart, sharepoint charts web part, sharepoint charting, sharepoint dashboard, charts for sharepoint
Скачать бесплатно! (10.16 Mb)
|
|

|
Excel Extract Data From Charts or Graph Software
Extract data from one or more charts in MS Excel. Save results as text files. Excel 2000 or higher required. Ключевые слова:
charting, graphing, plot, changing, change
Скачать бесплатно! (755 Kb)
|
|

|
TickInvest
Stock charting and technical analysis software with a user-friendly interface targeted for stock investors and realtime traders. Supported dataproviders are Yahoo and Interactive Brokers. Realtimecharts, Indicators, Easy to use script language... Ключевые слова:
stock charting, stock market, stock market, stock charts, realtime charts
Скачать бесплатно! (32 Mb)
|
|

|
Chart Geany
Technical Analysis Software for Windows, Linux and Mac Ключевые слова:
stocks, technical, investment, analysis, charts
Скачать бесплатно! (23.91 Mb)
|
|

|
TickInvest Free Edition
Stock charting and technical analysis software with a user-friendly interface targeted for stock investors and realtime traders. Supported dataproviders are Yahoo and Interactive Brokers. Realtimecharts, Indicators, Easy to use script language... Ключевые слова:
stock charting, stock market, stock market, stock charts, realtime charts
Скачать бесплатно! (27.8 Mb)
|
|

|
Grab It
Digitize graphs and charts quickly with our Excel based spreadsheet software. Distance measurement and angle determination capability also. Log, linear, date and time scales. Free demo! Ключевые слова:
digitize, graphic tablet, spreadsheet, excel, graph
Скачать бесплатно! (840 Kb)
|
|

|
J4L-RChart for Php
Set of Php Classes for creating charts and graphs. It supports more than 18 types (linechart, piechart, barchart, radarchart, curves , gauges, 3D charts, Candlestick, areacharts ....) and combinations of them. The complete Php source code is included Ключевые слова:
chart, charts, php, graph, graph
Скачать бесплатно! (1.05 Mb)
|
|

|
Grab It! XP
Digitize graphs and charts quickly with our Excel based spreadsheet software. Log, linear, date and time scales, distance measurement and angle determination capability also. Free upgrades forever! Ключевые слова:
digitize, graph, chart, excel, math
Скачать бесплатно! (840 Kb)
|
|
Страница: 1
| 2 | 3
| 4
| 5
|
|
|
|
