|

|
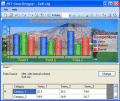
Smart Chart Designer
Smart Chart Designer is comprehensive charting application that supports over 40 chart types in multiple modes, meaning that literally hundreds of different styles and types are available for users. Ключевые слова:
.NET, Chart, Designer, Charting, Tool
Скачать бесплатно! (1.37 Mb)
|
|

|
Animated Chart Pro
XML Flash charts allows your to display live data on your website. Animated Chart Pro lets to create and customize XML-driven dynamic flash chart and publish it to website. Area, Bar, Bubble, Column, Doughnut, Line, Pie, Scatter, Radar, Stock charts. Ключевые слова:
xml flash chart, dynamic flash chart, chart, graph, flash chart
Скачать бесплатно! (2.67 Mb)
|
|

|
.NET Chart Designer
.NET Chart Designer is comprehensive charting application that supports more then 40 chart types in multiple modes, meaning that literally hundreds of different styles and types are available for users. Ключевые слова:
.NET, Chart, Designer, Charting, Tool
Скачать бесплатно! (1.26 Mb)
|
|

|
Chart Tools for Excel
With this Excel add-in you will be able to: Copy and paste format from a chart to another one, Resize and save charts, Add images, Add and move labels, Configure quickly the most common tasks in your spreadsheets and More... Ключевые слова:
chart tools, chart tools for excel, excel charts tools, excel graphics, charts format
Скачать бесплатно! (2.49 Mb)
|
|

|
Chartgantt Basic Demo
Chartgantt templates offers users functionality not previously found in excel based gantt charts. There are 5 different paid versions of the software to meet the most sophisticated planning needs. These tools have been tested by over 1000 users. Ключевые слова:
Gantt Chart, Gantt Chart Excel, Gantt Chart Template, Free Gantt Chart
Скачать бесплатно! (466 Kb)
|
|

|
.Net Chart Control
Chart Control .NET is the perfect solution to add the most advanced, feature rich charts to Windows Forms and ASP.NET applications. Over 40 2D/3D charts are available. Uses OpenGL (3D) and GDI+ (2D) for fast-rendering charts. Ключевые слова:
.Net chart, chart control, .Net chart control, .Net control, Control Chart .net
Скачать бесплатно! (4.85 Mb)
|
|

|
MatchStatistics
A program for statistical analysis of sports betting odds. User may create and test different sports betting systems and see effect on a chart. A huge database of historical odds and results of over 130.000 sport events is included with program. Ключевые слова:
sports betting system, odds analysis, bankroll management, valuebets, betting arbitrage
Скачать бесплатно! (17.68 Mb)
|
|

|
JavaScript Chart Standard
Shield UI Chart is feature rich and facilitates the creation of visually impressive charts and sharp graphics. The Chart control has many built-in features, which cover many of the common data visualization scenarios. Ключевые слова:
javascript chart, html5 chart, asp.net, mvc, apache wicket
Скачать бесплатно! (1.8 Mb)
|
|

|
Nevron Chart for .NET
Nevron Chart for .NET is a professional charting component for .NET, featuring numerous business, scientific and financial charting types, gauges, VS design time support, AJAX support, built-in toolbar, flexible axes, and much more. Ключевые слова:
bar graph, charting, .net chart, .net gauge, bar chart
Скачать бесплатно! (32 Mb)
|
|

|
LeoDataAnalysis
Statistical analysis, fitting and visualization of multi-parameter data sets. Statistical schemes cover creating conditional histograms, curve fitting with least square method and user defined formula, multivariate state of art fitting. Ключевые слова:
data analysis, curve fit, multiavariate analysis
Скачать бесплатно! (1.44 Mb)
|
|
Страница: 1
| 2
| 3 | 4
| 5
|
|
|
|
