|

|
Dragonfly Chart .Net
.Net Window Form Chart Components can be widely applied in many industry HMI applications, financial and insurance applications, scientific research and analytical applications, development-simulation applications Ключевые слова:
Windows, Form, Control, .Net, HMI
Скачать бесплатно! (3.55 Mb)
|
|

|
LeoStatistic
Universal tool for statistical analysis and modeling of experimental and market data. Support import data from variety of data sources. Statistical schemes cover all major data modeling operations. Create report ready output. Ключевые слова:
data analysis, curve fit, multiavariate analysis
Скачать бесплатно! (496 Kb)
|
|
|
StatPlus:mac
Perform statistical analysis on a Mac in the familiar environment. Turn Microsoft Excel 2004 or 2008 into a powerful statistical package with StatPlus:mac. Stop wasting time learning new tools and perform complex statistical analysis right away! Ключевые слова:
mac, analysis, Excel, add-in, probit
Скачать бесплатно! (18.94 Mb)
|
|
|
Triangle Chart Patterns Software
Triangle pattern is the most traded chart pattern in currency trading. There are three types of triangles most traded in currency trading. Ключевые слова:
Triangle chart patterns, nifty live chart, candlestick patterns, technical charts, trading charts
Скачать бесплатно! (488 Kb)
|
|
|
Manco.Chart for Compact Framework
Manco.Chart for Compact Framework is the perfect solution to add the most advanced, feature rich charts to the applications written for .NET Compact Framework platform (Windows Mobile). Ключевые слова:
chart, control, .net, compact, framework
Скачать бесплатно! (1.19 Mb)
|
|

|
Develve
This statistical package helps with analysis and prevents making false assumptions. In short it makes statistics faster and easier, suitable for less experience users but advanced enough for more demanding users. Ключевые слова:
Software for Statistics, Process Improvement, Six Sigma, Quality, statistical tool
Скачать бесплатно! (3.16 Mb)
|
|
|
BioStat 2008
BioStat - user-friendly biology and medicine oriented statistical software.With BioStat 2008, one gets a robust suite of statistics tools and graphical analysis methods that are easily accessed though a simple interface. Promo price. Ключевые слова:
probit, statistics, statistical, analysis, time
Скачать бесплатно! (31.09 Mb)
|
|
|
Chart Patterns Tutorial
Chart Patterns Tutorial is a software for investors and traders. This tool can help you to learn Fibonacci Price Pattern, Harmonic Pattern, and Elliott Wave. In addition, this tool provides Fibonacci Ratio Calculator and Pivot Point Calculator. Ключевые слова:
Chart Patterns, Fibonacci Analysis, Harmonic Pattern, Elliott Wave, X3 Chart Pattern
Скачать бесплатно! (891 Kb)
|
|

|
Hard Drive Pie Chart Software
Compare the size of folders with one another. Output is produced in an easy-to-read pie chart. Ключевые слова:
comparing hard drive sizes, Disk pie chart software, pies, piechart, space
Скачать бесплатно! (754 Kb)
|
|

|
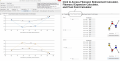
5dchart Add-In (for MS Excel)
5dchart Add-In (for Microsoft Office Excel) provides unmatched flexibility and highly customizable bubble-chart visualization for complex multi-dimensional data. Ключевые слова:
bubble chart, 3D bubble chart, scatter plot, 3D scatter plot, chart generator
Скачать бесплатно! (541 Kb)
|
|
Страница: 1
| 2
| 3
| 4 | 5
|
|
|
|
