Bubble Maps, Scatter Plot and Circle Charts
Bubble Maps Software 9.0
Bubble maps software does scatter plot and circle charts in Excel, useful for advanced business analysis.
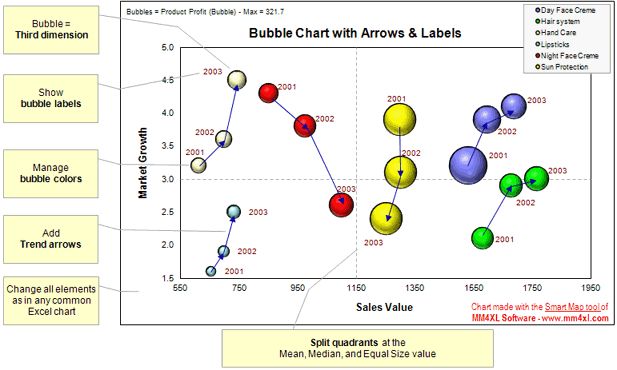
Excel provides the ability to draw bubble maps and scatter plots, but they are less refined than a bubble map you can make with the Smart Bubble Charts software. In Excel: (1) Chart labels cannot be displayed; (2) Arrows linking bubbles are not available; (3) Changing bubble color is a tedious process; (4) There is no way to automatically rescale quadrants or set the horizontal axis to a mean or median value; (5) The bubble maps tool of MM4XL software helps you overcome these and other limitations and save a lot of time.
A scatter diagram is an effective tool for investigating relationships among variables. It can be employed to investigate: Segmentations occurring in the data set; Associations between dependent and independent variables;
Predictions of future performance.
Thinking of marketing and sales, bubble maps help managers and analysts to: Identify groups of competitors that perform in a similar manner; Analyze the spread of sales among products; Search for free and interesting market opportunities; Find relationships and association among variables.
The Smart Bubble Charts tool is used by business decision-makers and business analysts.