|
|
Bubble Maps Software
MM4XL software - Bubble maps, scatter plot and circle charts in Excel. Useful for marketing segmentation, association and prediction analysis Ключевые слова:
scatter plot, scatter plots, circle maps, bubble charts, bubble maps
Скачать бесплатно! (16.32 Mb)
|
|
|
Antaeus
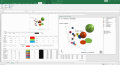
Antaeus is a utility that provides simple way to explore data plots that can be used to confirm or deny the merits of statistical analyses. In Antaeus, the scatter plots become a world of navigable data visualization. Ключевые слова:
exploratory data analysis, EDA, data analysis, knowledge discovery, data mining
Скачать бесплатно! (21.95 Mb)
|
|
|
Graph Converter Lite Rus
Данная простая в освоении программа даст Вам возможность перевести все имеющиеся на бумаге графики и диаграммы в электронный вид. Просто отсканируйте график, откройте изображение в прграмме GCL, произведите калибровку. Ключевые слова:
Graph, Converter
Скачать бесплатно! (820 Kb)
|
|
|
Falco Graph Builder
Построитель графиков. Ключевые слова:
Falco, Graph, Builder
Скачать бесплатно! (3.66 Mb)
|
|
|
5dchart Add-In (for MS Excel)
5dchart Add-In (for Microsoft Office Excel) provides unmatched flexibility and highly customizable bubble-chart visualization for complex multi-dimensional data. Ключевые слова:
bubble chart, 3D bubble chart, scatter plot, 3D scatter plot, chart generator
Скачать бесплатно! (541 Kb)
|
|
|
Super 2d/3d Graph Library
Award-winning .NET library for 2d and 3d chart drawing. Can be used either as a Winform control or in ASP.NET web pages. Professional Edition only 99?‚¬. Royalty-free! Ключевые слова:
svg chart, PDF chart, scalable vector graphics, data visualization, data charts
Скачать бесплатно! (1.23 Mb)
|
|
|
Graph Converter Lite
Данная простая в освоении программа даст Вам возможность перевести все имеющиеся на бумаге графики и диаграммы в электронный вид. Просто отсканируйте график, откройте изображение в прграмме GCL, произведите калибровку. Ключевые слова:
Graph, Converter
Скачать бесплатно! (1.92 Mb)
|
|
|
5dchart Add-In for MS Excel
5dchart Add-In (for Microsoft Office Excel) provides unmatched flexibility and highly customizable bubble-chart visualization for complex multi-dimensional data. Ключевые слова:
bubble chart, 3D bubble chart, scatter plot, 3D scatter plot, chart generator
Скачать бесплатно! (6.42 Mb)
|
|
|
Audio Graph ActiveX
With this ActiveX (OCX) component you can display a meter, detect a silence, and display 2 types of audio graphs by the WaveIn/WaveOut buffers. Just send a pointer of the buffers array to the component the component will do the rest on the graph view Ключевые слова:
audio graph activex, audio graph ocx, wav, meter, silence detection
Скачать бесплатно! (806 Kb)
|
|
|
Animated Chart Pro
XML Flash charts allows your to display live data on your website. Animated Chart Pro lets to create and customize XML-driven dynamic flash chart and publish it to website. Area, Bar, Bubble, Column, Doughnut, Line, Pie, Scatter, Radar, Stock charts. Ключевые слова:
xml flash chart, dynamic flash chart, chart, graph, flash chart
Скачать бесплатно! (2.67 Mb)
|
|
Страница: 1 | 2
| 3
| 4
| 5
|
|
|
|