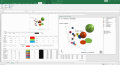
Скачать свежий бесплатный софт
scatter plot
scatter plot matrix
scatter plot array
scatter
scatter sudoku
scatter chart
scatter diagram
scatter graph
scatter plots
unique scatter sudoku
plot
multiple plot
Бизнес :: Приложения
Дом и Обучение :: Математика
Бизнес :: Финансы
Create 3D bubble charts and 3D scatter plots

5dchart Add-In (for MS Excel)


5dchart Add-In (for Microsoft Office Excel) provides unmatched flexibility and highly customizable bubble-chart visualization for complex multi-dimensional data.

Ключевые слова:
bubble chart, 3D bubble chart, scatter plot, 3D scatter plot, chart generator

Скачать бесплатно! (541 Kb)


Create 3D bubble charts and 3D scatter plots

5dchart Add-In for MS Excel


5dchart Add-In (for Microsoft Office Excel) provides unmatched flexibility and highly customizable bubble-chart visualization for complex multi-dimensional data.

Ключевые слова:
bubble chart, 3D bubble chart, scatter plot, 3D scatter plot, chart generator

Скачать бесплатно! (6.42 Mb)


A tool for exploring scatter plots.

Antaeus


Antaeus is a utility that provides simple way to explore data plots that can be used to confirm or deny the merits of statistical analyses. In Antaeus, the scatter plots become a world of navigable data visualization.

Ключевые слова:
exploratory data analysis, EDA, data analysis, knowledge discovery, data mining

Скачать бесплатно! (21.95 Mb)


Scientific data visualization software.

Visual Data For Academic


Scientific data visualization software. Creating vertex, grid and surface model, color map, contour plot, vector plot, 4D scatter, 4D slice and 4D vector.

Ключевые слова:
visual data, data visualization, data visualization software

Скачать бесплатно! (3.15 Mb)


Bubble Maps, Scatter Plot and Circle Charts

Bubble Maps Software


MM4XL software - Bubble maps, scatter plot and circle charts in Excel. Useful for marketing segmentation, association and prediction analysis

Ключевые слова:
scatter plot, scatter plots, circle maps, bubble charts, bubble maps

Скачать бесплатно! (16.32 Mb)


Interactive JavaScript and GWT charts.

ArcadiaCharts


Free charting library: arcadiaCharts builds attractive, interactive 2D and 3D JavaScript and GWT charts within minutes. No Flash required. Line, area, pie, donut (doughnut), bar, column, scatter, xy, logarithmic scale charts, time plot.

Ключевые слова:
charts, free, javascript, GWT, ajax

Скачать бесплатно! (12.19 Mb)


Calculus grapher for calculus teaching.

Visual Calculus For Academic


Visual Calculus is an easy-to-use calculus grapher for Graphing limit, derivative function, integral, 3D vector, series, ode etc. Which can create 2D, 2.5D and 3D function graphs, animations and table graphs.

Ключевые слова:
calculus grapher, calculus, pre calculus

Скачать бесплатно! (3.75 Mb)


Great amusing 3D screen saver with funny plot

Arctic Disco Screensaver


Great amusing 3D screen saver with funny plot and animation by JigsawPuzzle.com This polar bear will make you laugh for sure as it dances very funny. 3D models, bright colors, popular music and absolutely freeware.

Ключевые слова:
screensaver, screen saver, download, freeware, free

Скачать бесплатно! (1.92 Mb)


Chart design tool

Chartz


Charting tool for the rapid design of 13 different chart types, including bar, dot, horizontal bar, line, pie, donut, scatter, xy, area, histogram, error bar, bubble, gantt and volume charts. Additional features include 3D and multiple datasets

Ключевые слова:
bar, dot, line, pie, donut

Скачать бесплатно! (7.63 Mb)


Free 3D graphics great animated screen saver

Merry Dino Screensave


Free 3D animated screen saver by Hidden-Object-Online.com Dinosaur dances in a funny manner at the inhabited island. Great 3D graphics, picturesque landscape, funny plot will capture you for sure. The screensaver is absolutely free.

Ключевые слова:
screensaver, screen saver, 3D, funny, freeware

Скачать бесплатно! (2.14 Mb)


Страница: 1 | 2 | 3 | 4 | 5
Категории:
Свежий софт:
Наши проекты: