|
|
AnyChart Flash Map Converter
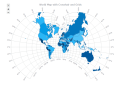
Convert ESRI ShapeFiles (.SHP) geolocation data into AnyMap format to be used with AnyChart. AnyChart Flash Map Converter allows making use of a wide choice of maps with AnyChart, a GIS system that recognizes map data in AnyMap format only. Ключевые слова:
Flash Map, Data visualization, GIS, Flash chart, AnyChart
Скачать бесплатно! (1.62 Mb)
|
|
|
AnyChart Flash Chart Component
Anychart набор Flash (SWF) файлов позволяющий создавать анимированные графики. Компонент позволяет создавать компактные, интерактивные и красивые графики. Управляется XML интерфейсом. Не требует инсталяции. Легок во внедрении в сайт и приложение. Ключевые слова:
AnyChart, Chart, Graphs, Macromedia, Flash
Скачать бесплатно! (7.03 Mb)
|
|
|
AnyChart Flash Gantt Component
Anychart Flash Gantt is a superb, customizable component for displaying Gantt charts. It is light, fast and highly effective for use in web applications. Create groups, connectors and milestones with a simple XML configuration! Ключевые слова:
Chart, Graphs, Flash Chart, gantt, gantt chart
Скачать бесплатно! (13.2 Mb)
|
|
|
AnyChart Flash Map Component
Anychart Flash Maps Flexible XML-Driven solution: US, World, US Counties. You can add background and captions, XML data file and a set of customizable options make AnyChart Maps a universal solution for web developers. Ключевые слова:
AnyChart, Chart, Macromedia, Flash, flashmaps
Скачать бесплатно! (2.77 Mb)
|
|
|
AnyChart JS Charts and Dashboards
AnyChart is a flexible, cross-platform/browser, dependency-free JS chart library for adding interactive bar, area, pie, column, spline, scatter, line, gauge, treemap, funnel, sparkline, Mekko, Venn, other HTML5 charts/dashboards to any website/app. Ключевые слова:
anychart, charts, javascript charts, ajax charts, html5 charts
Скачать бесплатно! (17.81 Mb)
|
|
|
GraphicsJS
GraphicsJS is a free, open-source JavaScript library for easily drawing any interactive HTML5 graphics and animation. It's lightweight and supports powerful line drawing (curves, arcs...), multiline texts, virtual DOM, smart layering, convenient API. Ключевые слова:
JavaScript, SVG, VML, opensource, graphics
Скачать бесплатно! (418 Kb)
|
|
|
AnyMap JS Maps
AnyMap JS Maps is an advanced JavaScript-HTML5 mapping library with the ever-expanding Map Collection, which makes you able to easily create interactive maps looking great on PCs, Macs, iPhones, iPads, Androids and other devices. Highly customizable. Ключевые слова:
javascript maps, html5 maps, anychart, anymap, interactive map
Скачать бесплатно! (17.81 Mb)
|
|
|
AnyStock Stock and Financial JS Charts
AnyStock Stock and Financial JS Charts is a flexible JavaScript charting library to visualizing large data sets in interactive HTML5 charts. Designed to display date/time information it offers various chart types, drawing tools, technical indicators. Ключевые слова:
anystock, stock charts, javascript charts, financial charts, forex charts
Скачать бесплатно! (17.81 Mb)
|
|
|
AnyChart Stock and Financial Flash Chart
AnyStock — гибкий компонент для создания интерактивных биржевых и финансовых графиков. XML/JSON-интерфейс, удобная навигация, поддержка больших массивов данных и региональных стандартов, технические индикаторы, инструменты для рисования. Ключевые слова:
AnyStock, AnyChart, Financial Charts, Stock Charts, Technical Analysis
Скачать бесплатно! (1.81 Mb)
|
|
|
AnyGantt JS Gantt Charts
AnyGantt is a flexible, cross-platform and cross-browser JavaScript charting library that allows you to easily build smart HTML5 Gantt Charts and utilize the power of animation and ultimate interactivity to facilitate project and resource management. Ключевые слова:
anygantt, gantt charts, javascript charts, ajax charts, html5 charts
Скачать бесплатно! (17.81 Mb)
|
|
Страница: 1 | 2
|
|
|
|