|

|
Nevron Chart for SharePoint
Nevron Chart for SharePoint is an advanced web part, delivering a complete and unmatched set of 2D and 3D charting types, highly customizable axes, advanced data analysis, numerous tuning options and stunning visual effects to your SharePoint sites. Ключевые слова:
SharePoint, SharePoint charts, SharePoint chart, chart sharepoint, moss chart
Скачать бесплатно! (32 Mb)
|
|
|
Vancharts (Single developer)
VanCharts (http://www.vancharts.com/) is a free library for making visual charts. It supports data display in the web (JavaScript) and mobile terminals (Android native/iOS native/Webview) and provides various types of common commercial charts. Ключевые слова:
JavaScript Charting Library, javascript charts, jquery charts
Скачать бесплатно! (229 Kb)
|
|
|
RadarCube OLAP Chart Windows Forms
.NET Windows Forms OLAP control to add Visual Analysis to your applications. Displays business data in charts and graphs rather than in numbers. Works with a relational database or MS Analysis Services. 100% managed code authored entirely in C# 2.0. Ключевые слова:
OLAP, Pivot, Windows Forms, BI, Business Intelligence
Скачать бесплатно! (29.28 Mb)
|
|
|
TeeChart NET for Xamarin.Forms
TeeChart Charting Controls for Xamarin.Forms offer the most common chart types, gauges and maps with customizable tools for data visualisation in mobile applications. Ключевые слова:
Chart Control, .NET for Xamarin.Forms, Chart for Xamarin.Forms, Xamarin Forms chart, Charts for Xamarin
Скачать бесплатно! (18.75 Mb)
|
|

|
Disk Space Analyzer
Disk Space Analyzer generates chart showing disk usage distribution according folders and files. Ключевые слова:
Free Disk Space Analyzer, Free Disk Space Browser, Free Disk Cleaner, Find Duplicates Free, Free Disk Analyzer
Скачать бесплатно! (921 Kb)
|
|
|
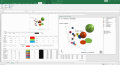
5dchart Add-In for MS Excel
5dchart Add-In (for Microsoft Office Excel) provides unmatched flexibility and highly customizable bubble-chart visualization for complex multi-dimensional data. Ключевые слова:
bubble chart, 3D bubble chart, scatter plot, 3D scatter plot, chart generator
Скачать бесплатно! (6.42 Mb)
|
|
|
RiskyProject Lite
RiskyProject Lite is a schedule risk analysis software. Project managers can use RiskyProject Lite for schedule risk analysis of projects and portfolios with multiple risks and uncertainties. Ключевые слова:
project risk management, schedule risk analysis, project schedule risk analysis, schedule risk analysis software, risk management
Скачать бесплатно! (15.08 Mb)
|
|

|
Gantt Chart Library
Gantt Chart related components for WPF and .NET 4 Ключевые слова:
Gantt Chart, Gantt, chart, list, grid
Скачать бесплатно! (14.78 Mb)
|
|

|
SharpShooter OLAP
SharpShooter OLAP includes OLAP components for multidimensional data analysis and for data representation in the form of charts. The product allows the creation of analytical applications for decision support systems. Ключевые слова:
OLAP, .NET, Pivot table, data cube, analytical data processing
Скачать бесплатно! (32 Mb)
|
|
|
Ashkon Stock Watch
Ashkon Stock Watch is an advanced charting software for financial market information. It allows to display several technical indicators for a single security on the same chart, open multiple chart documents and test investment strategies. Ключевые слова:
stock, market, financial, chart, charting
Скачать бесплатно! (4.45 Mb)
|
|
Страница: 1
| 2
| 3
| 4 | 5
|
|
|
|
