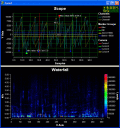
PlotLab is a set of .NET 2.0/3.5 components for very easy and fast Data Visualization. Allows very fast display in a Plot/Scope/Chart or Waterfall form. Great for FFT Visualization! Free for non-commercial use.
PlotLab is a set of Visual C++ components for very easy and fast Data Visualization. They allow very fast display in a Plot/Scope/Chart or Waterfall form. Great for FFT Visualization! Free for non-commercial use.
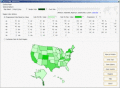
a tool to make region map with self-definition color. The original maps in the software are blank political region ones for different countries or areas. You can color any region with whatever color as you like.
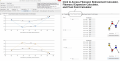
Chart Patterns Tutorial is a software for investors and traders. This tool can help you to learn Fibonacci Price Pattern, Harmonic Pattern, and Elliott Wave. In addition, this tool provides Fibonacci Ratio Calculator and Pivot Point Calculator.
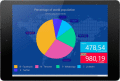
Charting library for Android platform, written in native Android Java and supports most teechart series types including pie chart, line chart, points, area, bar, gauges and maps and 2D, 3D formats.The Charting library includes 100% native Java code.