Скачать свежий бесплатный софт
create a pie chart
create chart
create flow chart
create a chart in excel
create a flow chart
create organization chart
create flash chart
js chart
chart net
vcl.net chart
c chart
3d chart
Утилиты :: Системные Утилиты
Инструменты Разработчика :: Компоненты и Библиотеки
Инструменты Разработчика :: ActiveX
JQuery Charts for Microsoft SharePoint

Virto JQuery Charts for SharePoint


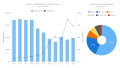
Virto Charts is a jQuery-based control for creating plots, graphs and charts in Microsoft SharePoint. Virto component produces beautiful line, bar and pie charts with many features.

Ключевые слова:
sharepoint, web part, chart, graph, plot

Скачать бесплатно! (1.01 Mb)


.NET charting controls for WPF.

MindFusion.Charting for WPF


Easy to use .NET gauge and charting controls for WPF applications. The package includes Graph, Line, Area, Bar, Radar and Pie chart components and Oval and Linear gauges. Each of them can be fully customized via the hundreds properties and methods.

Ключевые слова:
pie, line, area, bar, chart

Скачать бесплатно! (9.73 Mb)


.NET charting controls for ASP and WinForms.

MasterChart


Easy to use .NET charting controls for ASP.NET and Windows Forms applications. The package includes Graph, Line, Area, Bar and Pie Chart components. Each of them can be fully customized via the hundreds properties and methods. Royalty free.

Ключевые слова:
pie, line, area, bar, chart

Скачать бесплатно! (8.39 Mb)


.NET gauge and chart controls for WinForms.

MindFusion.Charting for WinForms


Easy to use .NET gauge and charting controls for Windows Forms applications. The package includes Graph, Line, Area, Bar, Radar and Pie charts and Oval and Linear gauges. Each of them can be fully customized via the hundreds properties and methods.

Ключевые слова:
pie, line, area, bar, radar

Скачать бесплатно! (6.29 Mb)


Chart control creates 40 2D/3D charts.

.Net Chart Control


Chart Control .NET is the perfect solution to add the most advanced, feature rich charts to Windows Forms and ASP.NET applications. Over 40 2D/3D charts are available. Uses OpenGL (3D) and GDI+ (2D) for fast-rendering charts.

Ключевые слова:
.Net chart, chart control, .Net chart control, .Net control, Control Chart .net

Скачать бесплатно! (4.85 Mb)


OCX control to draw pie, bar, line graphs.

CsXGraph


ActiveX control to draw 2D pie charts, bar charts and line graphs. Display the graphs, export to file (GIF, PNG, BMP) or data stream or copy to the clipboard. Properties allow full control over colours and fonts. Free trial.

Ключевые слова:
ocx, activex, component, control, graph

Скачать бесплатно! (991 Kb)


Creates a variety of charts from data as PDF

PDF Chart Creator Command Line Tool


PDF Chart Creator is a utility that converts data into a chart PDF document. The conversion process is initiated by calling PDFChart.exe directly from the command line, or from within a batch file, with parameters that control it's operation.

Ключевые слова:
pdf chart creator, create pdf charts, pdf graph creator, create pdf graphs, royalty free

Скачать бесплатно! (291 Kb)


.NET компонент для построения графиков.

Chart ModelKit


Chart ModelKit – компонент графического отображения данных со встроенным дизайнером, обеспечивающим режим полного соответствия (WYSIWYG), и усовершенствованной моделью привязки данных. Библиотека содержит набор стандартных элементов и типов графиков.

Ключевые слова:
chart net, net charting, chart component, charting component, pie chart

Скачать бесплатно! (32 Mb)


Flash component for graphs and charts buildin

FlyCharts Flash Chart Component


FlyCharts is a chart flash component. It is a set of Adobe Flash (SWF) files that gives an outstanding possibility to visualize data. FlyCharts help create compact, interactive and good-looking flash graphs and charts for web applications.

Ключевые слова:
flycharts, chart, flash, flash component, graphs

Скачать бесплатно! (452 Kb)


AnyChart: flexible JS (HTML5) chart library.

AnyChart JS Charts and Dashboards


AnyChart is a flexible, cross-platform/browser, dependency-free JS chart library for adding interactive bar, area, pie, column, spline, scatter, line, gauge, treemap, funnel, sparkline, Mekko, Venn, other HTML5 charts/dashboards to any website/app.

Ключевые слова:
anychart, charts, javascript charts, ajax charts, html5 charts

Скачать бесплатно! (17.81 Mb)


Страница: 1 | 2 | 3 | 4 | 5
Категории:
Свежий софт:
Наши проекты: