|

|
Atlantis Schema Surf
Atlantis Schema Surf is our SQL dependency & live entity ER diagram tool - it is a free animated graphing tool which allows you to easily visualize the dependencies between the objects in your SQL Server databases in a live entity ER diagram. Ключевые слова:
SQL Server, Schema Navigation, Schema Exploration, Schema Visualization, Dependency Visualization
Скачать бесплатно! (7.38 Mb)
|
|

|
5dchart Add-In for MS Excel
5dchart Add-In (for Microsoft Office Excel) provides unmatched flexibility and highly customizable bubble-chart visualization for complex multi-dimensional data. Ключевые слова:
bubble chart, 3D bubble chart, scatter plot, 3D scatter plot, chart generator
Скачать бесплатно! (6.42 Mb)
|
|

|
VisioTask Free Task Management Software
Выбери главное, яснее и проще. Используй мощь визуализации. Вруби форсаж своей продуктивности с бесплатным приложением для управления задачами. См. больше на www.visiotask.com. Поехали! Ключевые слова:
Free task management software, task software, task management, task lists, task management tool
Скачать бесплатно! (12.19 Mb)
|
|

|
Audio Control
Audio Control is an audio mixer software utility for visualization and control of the computer audio volume, and is an improved substitution for the standard Windows Volume control. Audio Control saves space and allows for easy audio volume control. Ключевые слова:
Audio Control, Audio Volume Control, Volume Control, Windows Volume Control, Save Screen Space
Скачать бесплатно! (11.55 Mb)
|
|

|
NuGenFractalX
NuGenFractalX is fractal visualization and generation application for the .NET platform. Fractal sets can be saved, zoomed, rotated, manipulated with unlimited color views and gradients and also exported as multiple image types. Ключевые слова:
Fractals, Mathematics, Rendering
Скачать бесплатно! (787 Kb)
|
|

|
Circuit Design simulation Component
Build your own Multisim like circuit design and simulation application!
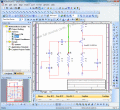
Diagrams are a natural and intuitive way of expressing relationships in your application data. E-XD++ Components make it easy to add expressive, interactive Circuit Design Ключевые слова:
Circuit Design and interactive simulation, Animation and Cicuit analysis, Circuit layout visualization VC++ Source Code solution
Скачать бесплатно! (488 Kb)
|
|

|
CoolCD Studio
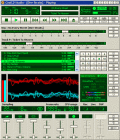
CoolCD Studio - проигрыватель Audio CD дисков. Полностью поддерживает CDDB, CD-Text, имеет встроенную систему визуализации звука, многорежимный доступ к Audio CD, встроенный миксер, удобный менеджер базы данных дисков, различные режимы работы. Ключевые слова:
CD, disc, player, audio, digital
Скачать бесплатно! (1.64 Mb)
|
|

|
SharpShooter Collection
SharpShooter Collection is a package of .NET components for data processing, analysis and visualization. The suite includes a report generator, OLAP component, a tool for creating digital dashboards and KPI and a component for charts, graphs design. Ключевые слова:
.net reporting, .net data visualization
Скачать бесплатно! (32 Mb)
|
|

|
Data Visualization
Free (for commercial and non commercial use) generic cross platform and cross db reporting tool. Supports many dbs and many export formats like PDF, RTF, CSV, XML, HTML etc. Ключевые слова:
import, export, data base, db, Oracle
Скачать бесплатно! (14.84 Mb)
|
|

|
SharePoint Project Progress Monitor
SharePoint Project Progress Monitor visually enhances the status of a SharePoint project or task by displaying numerical data graphically in the form of percentage-based bars Ключевые слова:
SharePoint Project, color-coded progress bar, SharePoint percentage, SharePoint Custom Column, data visualization
Скачать бесплатно! (313 Kb)
|
|
Страница: 1
| 2
| 3
| 4
| 5
|
|
|
|
