|
|
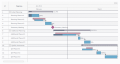
AnyGantt JS Gantt Charts
AnyGantt is a flexible, cross-platform and cross-browser JavaScript charting library that allows you to easily build smart HTML5 Gantt Charts and utilize the power of animation and ultimate interactivity to facilitate project and resource management. Ключевые слова:
anygantt, gantt charts, javascript charts, ajax charts, html5 charts
Скачать бесплатно! (17.81 Mb)
|
|

|
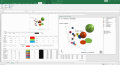
5dchart Add-In (for MS Excel)
5dchart Add-In (for Microsoft Office Excel) provides unmatched flexibility and highly customizable bubble-chart visualization for complex multi-dimensional data. Ключевые слова:
bubble chart, 3D bubble chart, scatter plot, 3D scatter plot, chart generator
Скачать бесплатно! (541 Kb)
|
|
|
5dchart Add-In for MS Excel
5dchart Add-In (for Microsoft Office Excel) provides unmatched flexibility and highly customizable bubble-chart visualization for complex multi-dimensional data. Ключевые слова:
bubble chart, 3D bubble chart, scatter plot, 3D scatter plot, chart generator
Скачать бесплатно! (6.42 Mb)
|
|
|
Plan for Windows
Project planning application for Windows. Create a project plan by entering tasks and resources, add holiday information and create dependencies between tasks. Includes display of Gantt chart. Can also directly read and write Microsoft Project files. Ключевые слова:
project, plan, gantt, chart, task
Скачать бесплатно! (1.12 Mb)
|
|
|
Free Microsoft Project Viewer
Free MOOS Project Viewer is a free Microsoft Project viewer that can open any MS Project file type (.mpp, .mpt, .mpx, .xml) for any Microsoft Project version (2000, 2003, 2007, 2010). Ключевые слова:
free Microsoft Project 2010 viewer, free MS Project viewer, free mpp viewer, free ms project reader, free mpp viewer for Microsoft Project
Скачать бесплатно! (9.51 Mb)
|
|

|
FusionCharts Free
FusionCharts Free helps you create free flash charts in your web applications. It supports a variety of chart types including bar, column, line, area, pie, doughnut (donut), combination, funnel, Gantt chart etc. Ключевые слова:
flash charts, flash chart, flash charting, flash graphs, flash graph
Скачать бесплатно! (4.22 Mb)
|
|

|
SmartChart XP
Smart-Chart is a MS-Excel based application that automatically creates Flow-Charts. The usability and advantage of these Flow-Charts have been increased immensely compared to the traditional Flow-Chart approach. Ключевые слова:
Flow-Chart, Microsoft Excel, MS-Excel, Excel, Chart-Tool
Скачать бесплатно! (844 Kb)
|
|
|
EJS TreeGrid
Cross-browser DHTML (AJAX) component written in pure JavaScript to display and edit data in table, grid, tree or grid with tree. Calculations, sorting, filtering, grouping. Gantt chart. Printing and export to Excel. Able to display 1 000 000 rows. Ключевые слова:
treeview, treegrid, tree, grid, webgrid
Скачать бесплатно! (292 Kb)
|
|

|
Project Planning Pro
Project Management App on Mac. Create a project plan in no time by entering tasks, duration and start dates. Use the interactive Gantt chart to edit and update the tasks easily. It also supports Microsoft Project Plan (.mpp files). Ключевые слова:
project planning, project management, project planner, task management, resource management
Скачать бесплатно! (12.73 Mb)
|
|

|
Virto SharePoint Resource Gantt Web Part
Virto Resource Utilization Gantt is the light-weight interactive Silverlight-based web part that provide SharePoint users with a variety of tools for resource management and online utilization tracking. Ключевые слова:
sharepoint, web part, resource utilization, resource Gantt, resource view
Скачать бесплатно! (2.4 Mb)
|
|
Страница: 1
| 2
| 3
| 4 | 5
|
|
|
|
