|

|
Health Measure Graph
HealthMeasureGraph — персональная записная книга изменений вашего организма в графиках. Теперь вы можете контролировать свой вес, пульс, давление, температуру тела (Цельсий или Фаренгейт) и даже заносить результаты лабораторных анализов крови и мочи Ключевые слова:
temperature, body, graph, pulse, graph of body temperature
Скачать бесплатно! (1.46 Mb)
|
|

|
Grapholic
Grapholic is an extremely useful tool for maximizing data visualization. You can convert your raw data into meaningful Graphs in just a few clicks. The simple steps you follow are Import, plot, modify and export to get your data in graphical form. Ключевые слова:
Graph making software, graphing solution, plotting charts, creating bar graphs, line graphs
Скачать бесплатно! (8.12 Mb)
|
|

|
XYZ Data Viewer
XYZ Data Viewer is an easy way to analyze a variety of tabular data from Microsoft Excel in the view of 3-dimensions graph. With this tool You can view and examine your data as a three-dimensional object in three-dimensional space, by manipulate it. Ключевые слова:
dimensions, graph, chart, excel, table
Скачать бесплатно! (9.06 Mb)
|
|

|
ScanIt
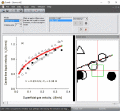
Obtain data from images of graphs scanned from articles or available as image; define locations of the graph's axes, pick points, scan points or scan curves, copy the scanned data to Excel or save to file. Ключевые слова:
digitize, extract, data, graph, plot
Скачать бесплатно! (6.11 Mb)
|
|

|
Visual Complex For Academic
Visual Complex is a graph software to create graph of complex function. 3D function graphs and 2D color maps can be created with this grapher. Ключевые слова:
complex grapher, graph software, complex graphs
Скачать бесплатно! (1.86 Mb)
|
|

|
Speed Upp
Programmable metronome for training speed and precision on any musical instrument. It will guide you during scale exercises and chromatic drills by changing tempo according to clever pre-defined graph. Even better, you can define and save your own id Ключевые слова:
metronome, programmable, speed trainer, guitar, drums
Скачать бесплатно! (19.41 Mb)
|
|

|
CsDrawGraph
This ASP component draws pie and bar charts and line graphs on the fly. Output options include GIF, PNG, JPG and BMP. Stream to browser or save as a file. A wide range of properties allow the customisation of colour, size and text style. Ключевые слова:
asp, component, dll, activex, graph
Скачать бесплатно! (622 Kb)
|
|

|
CsASPNetGraph
This ASP.NET component draws pie and bar charts and line graphs on the fly. Graphs can be streamed to the browser as GIF or JPG images or saved to file. A wide range of properties allow the customisation of colour, size and text style. Ключевые слова:
asp, component, dll, aspnet, dotnet
Скачать бесплатно! (595 Kb)
|
|

|
FC_RTGraph
FC_RTGraph is a tool that allows you to collect and graph information from SNMP devices. FC_RTGraph takes an XML formatted config file as input. Ключевые слова:
snmp, graph, monitoring, rfc1213, xml
Скачать бесплатно! (1.71 Mb)
|
|

|
DataScene
DataScene is a data graphing, animation, and analysis software package. It allows the user to plot 39 types 2D & 3D graphs with brilliant quality, to create graph animations, to analyze data with various methods, and to chart real-time data sources. Ключевые слова:
Scientific, Data Graphing, Plotting, Charting, Animation
Скачать бесплатно! (32 Mb)
|
|
Страница: 1
| 2 | 3
| 4
| 5
|
|
|
|
