|

|
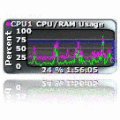
Speed Test Gadget
Speed Test is a meter that monitors your entire system. Mearuring CPU and RAM usage by itself and has the ability to test your Maximum Internet Speed (bandwidth), Website speeds, Hard Drive space and activity, Ping, WIFI, Battery, LAN,Upload,Download Ключевые слова:
traffic, Memory, monitor, Network, Wifi
Скачать бесплатно! (893 Kb)
|
|

|
DataScene Lite
DataScene Lite is a data graphing and data analysis software package. It allows the user to plot 39 types 2D & 3D graphs with brilliant quality and to analyze data with various methods. It is an ideal tool for scientific graphing and office uses. Ключевые слова:
Scientific, Data Graphing, Plotting, Charting, Data Analysis
Скачать бесплатно! (32 Mb)
|
|

|
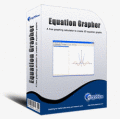
Equation Grapher
Equation grapher is a free graphing calculator to graph equations. Equation Grapher is a free graphing calculator to graph equations. Equation Grapher is a free graphing calculator to graph equations. Ключевые слова:
equation grapher, free graphing calculator, graph equation, graph equations
Скачать бесплатно! (1.23 Mb)
|
|

|
VDS ODBC
This library allows to extend possibilities of programming of Visual Dialog Script language firm S.A.D.E. ver. 5.X or high: Grid, Element of date, Graph, EditBox etc. The library works through ODBC driver. Ключевые слова:
Visual Dialog Script, VDS, ODBC, VDSODBC, AddIn
Скачать бесплатно! (1.7 Mb)
|
|

|
DataScene Express
DataScene Express is a data graphing and charting program. It allows the user to plot 39 types 2D & 3D graphs with brilliant quality. It supports a wide variety of graphical elements and is an ideal tool for scientific graphing and office uses. Ключевые слова:
Scientific, Data Graphing, Plotting, Charting, Graphing Software
Скачать бесплатно! (32 Mb)
|
|

|
MasterChart
Easy to use .NET charting controls for ASP.NET and Windows Forms applications. The package includes Graph, Line, Area, Bar and Pie Chart components. Each of them can be fully customized via the hundreds properties and methods. Royalty free. Ключевые слова:
pie, line, area, bar, chart
Скачать бесплатно! (8.39 Mb)
|
|

|
Animated Chart
Flash charts made easy. Software for generating animated interactive Flash charts and graphs for publishing to websites. Making graphs with Animated Chart is simple and quick and doesn't require any special knowledge of Flash or HTML. Ключевые слова:
flash chart, chart bar, chart line, chart data, graphs bar
Скачать бесплатно! (2.67 Mb)
|
|

|
Graph Digitizer Scout
Graph Digitizer Scout automatically converts hard-copy graphs, oscillograms, charts, plots,
into X,Y. Different recognition methods including manual correction mode. Data can be exported to Excel, CSV format and other applications. Ключевые слова:
digitize, x, y, data, convert
Скачать бесплатно! (5.19 Mb)
|
|

|
MindFusion.Charting for WinForms
Easy to use .NET gauge and charting controls for Windows Forms applications. The package includes Graph, Line, Area, Bar, Radar and Pie charts and Oval and Linear gauges. Each of them can be fully customized via the hundreds properties and methods. Ключевые слова:
pie, line, area, bar, radar
Скачать бесплатно! (6.29 Mb)
|
|

|
MindFusion.Charting for WPF
Easy to use .NET gauge and charting controls for WPF applications. The package includes Graph, Line, Area, Bar, Radar and Pie chart components and Oval and Linear gauges. Each of them can be fully customized via the hundreds properties and methods. Ключевые слова:
pie, line, area, bar, chart
Скачать бесплатно! (9.73 Mb)
|
|
Страница: 1
| 2
| 3 | 4
| 5
|
|
|
|
