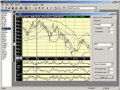
Point & Figure Charts software is a stock analysis tool for individual investors and traders to identify buy-and-sell signals. The premier feature is Point & Figure Chart that is implemented with classic scale and custom scale. and much more.
Financial Charting Component is powerful charting compoent and is designed for stock charting specifically. It has strikng visual effects, great interactivity, zoom and pan functions. It is built with other most frequently used graphic shapes.
Tulip Cell is a Microsoft Excel add-in that provides over 100 technical analysis overlays and indicators. It provides indicators like moving average, MACD, Bollinger Bands, Stochastic, RSI, Parabolic SAR, and many more. Tulip Cell is completely free.
AnyStock Stock and Financial JS Charts is a flexible JavaScript charting library to visualizing large data sets in interactive HTML5 charts. Designed to display date/time information it offers various chart types, drawing tools, technical indicators.
Personal Stock Monitor Gold enables the active investor to quickly research, track, chart, and trade stock market securities within the privacy of a personal desktop Windows application. It features technical analysis, alerts, gain/loss, and more.
CharTTool is an advanced stock market charting software that instantly allows you to display several technical charts of stocks, mutual funds, currencies or market indices in intraday or end of day chart format. Technical analysis is also available.
Ashkon Stock Watch is an advanced charting software for financial market information. It allows to display several technical indicators for a single security on the same chart, open multiple chart documents and test investment strategies.
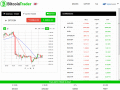
Binary Options Robot Software to trade automatically the Binary Options. Binary Option Robot will analyse the trend of the market in real-time and will call or put at your place on the right currencies and at the right moment.