|

|
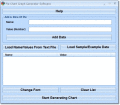
Pie Chart Graph Generator Software
Create pie charts based on numbers and their corresponding labels. Ключевые слова:
creating pie charts, graph, graphing, statistics, without excel
Скачать бесплатно! (754 Kb)
|
|

|
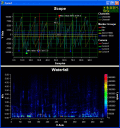
PlotLab VCL
Delphi/C++ Builder VCL/FMX components library for very easy and fast Data Visualization. Allows very fast display in a Plot/Scope/Chart or Waterfall form. Great for FFT or Histogram Visualization! Free for non-commercial use. Ключевые слова:
Chart, Scope, Plot, Waterfall, Plotting
Скачать бесплатно! (32 Mb)
|
|

|
3DField
3DField is a contouring plotting and 3D data program. It converts your data into contour maps, surface or volume plots. Rotate image Ключевые слова:
3D, map, contour, gridding
Скачать бесплатно! (3.15 Mb)
|
|

|
HealthWatch Home Edition
HealthWatch Home is designed for personal and family. It can calculate growth percentiles, blood pressure percentiles and BMI, evaluate underweight and overweight, identify metabolic syndrome, and calculate risk for having a heart attack. Ключевые слова:
CDC growth charts, growth percentile, weight percentile, height percentile, blood pressure percentile
Скачать бесплатно! (2.5 Mb)
|
|

|
Live Forex Charts
Free, simple and powerful live forex charts software provides traders with comprehensive view of the online trading charts and access to currency movements. Real-time fx and currency charts with technical indicators and online forex charting tool. Ключевые слова:
forex charts, forex chart, fx charts, forex charting, real time forex chart
Скачать бесплатно! (1.71 Mb)
|
|

|
FusionCharts for VB
FusionCharts for VB is a charting component for Microsoft Visual Basic 6.0. It allows you to render interactive and animated charts in your Visual Basic applications. It has the ability to render over 40 chart types spanning both 2D and 3D charts. Ключевые слова:
vb charting control, vb charting component, visual basic charting, vb visualization component, vb charts
Скачать бесплатно! (9.95 Mb)
|
|

|
Animated Chart
Flash charts made easy. Software for generating animated interactive Flash charts and graphs for publishing to websites. Making graphs with Animated Chart is simple and quick and doesn't require any special knowledge of Flash or HTML. Ключевые слова:
flash chart, chart bar, chart line, chart data, graphs bar
Скачать бесплатно! (2.67 Mb)
|
|

|
Collabion Charts for SharePoint
Collabion Charts for SharePoint lets you create stunning, Sharepoint-driven dashboards in SharePoint in just 15 minutes, without writing a single line of code. Ключевые слова:
sharepoint chart, sharepoint charts web part, sharepoint charting, sharepoint dashboard, charts for sharepoint
Скачать бесплатно! (10.16 Mb)
|
|

|
Eclipse Stock Charts Lite
"Eclipse Stock Charts Lite. Free Stock Charting Software with historical charts, technical analysis indicators and news." Ключевые слова:
stock, charting, software
Скачать бесплатно! (26.68 Mb)
|
|

|
HealthWatch Pro
HealthWatch Pro is designed for health professional. It can calculate growth percentiles, blood pressure percentiles and BMI, evaluate underweight and overweight, identify metabolic syndrome, and calculate risk for having a heart attack. Ключевые слова:
CDC growth charts, growth percentile, weight percentile, height percentile, blood pressure percentile
Скачать бесплатно! (2.5 Mb)
|
|
Страница: 1
| 2 | 3
| 4
| 5
|
|
|
|
