|

|
JGantt
JGantt is gantt chart component for Swing. Supports: simple data model, lazy loading, internationalization, in-place editing, data binding, date granularity controlled by zoom policy and unique chart layers painting . Fully customizable. Try it free. Ключевые слова:
java, gantt, jgantt, swing, swing gantt component
Скачать бесплатно! (1.23 Mb)
|
|

|
Dragonfly Chart .Net
.Net Window Form Chart Components can be widely applied in many industry HMI applications, financial and insurance applications, scientific research and analytical applications, development-simulation applications Ключевые слова:
Windows, Form, Control, .Net, HMI
Скачать бесплатно! (3.55 Mb)
|
|
|
Manco.Chart for .NET
Manco.Chart for .NET is a powerful charting component used to create attractive 3D and 2D charts for desktop applications and web pages using .NET technologies. 3D charting uses the OpenGL graphics engine to create sophisticated 3D charts and graphs. Ключевые слова:
.NET, chart, control, charting, Windows
Скачать бесплатно! (6.46 Mb)
|
|

|
OrgChart Express
OrgChart Professional sets the new standard in organizational charting software. Combining easy-to-use tools with powerful database functionality, OrgChart is used by HR professionals world-wide. Ключевые слова:
org chart, organization chart, human resources, organigram, organogram
Скачать бесплатно! (32 Mb)
|
|

|
Nevron Chart for SSRS
Nevron Chart for SSRS (market's leader for its visual style, effects,layout features and data integration) is a solution,designed to provide an easy and powerful way to implement state-of-art charts in any report, modified with MS Reporting Services. Ключевые слова:
Reporting Services, Chart, SQL Reporting Services, SQL, Dashboards
Скачать бесплатно! (32 Mb)
|
|

|
NextwaveSoft WPF Suite Chart and Gauge
Nextwave Software WPF Suite with WPF Chart and Gauge is a component suite that helps you to visualize your data in Windows Presentation Foundation applications. Ключевые слова:
NextwaveSoft, .Net, WPF, WPF Graph, WPF Gauge
Скачать бесплатно! (13.92 Mb)
|
|

|
UIChart iOS component
The Rustemsoft UIChart control enables to create iOS apps with simple, intuitive, and visually compelling chart for complex statistical or financial analysis in different graph types that include Pie, Bar, Line, Cylinder, Area, and other chart types. Ключевые слова:
UIChart, chart, ios chart, iphone, ipad
Скачать бесплатно! (3.05 Mb)
|
|
|
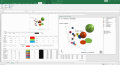
5dchart Add-In for MS Excel
5dchart Add-In (for Microsoft Office Excel) provides unmatched flexibility and highly customizable bubble-chart visualization for complex multi-dimensional data. Ключевые слова:
bubble chart, 3D bubble chart, scatter plot, 3D scatter plot, chart generator
Скачать бесплатно! (6.42 Mb)
|
|
|
Triangle Chart Patterns Software
Triangle pattern is the most traded chart pattern in currency trading. There are three types of triangles most traded in currency trading. Ключевые слова:
Triangle chart patterns, nifty live chart, candlestick patterns, technical charts, trading charts
Скачать бесплатно! (488 Kb)
|
|

|
Excel Gantt Chart Template Deluxe
Excel Gantt Chart Template. Create Gantt charts in Excel. Manage daily, weekly and monthly projects in Excel. Manage up to 100 tasks and team members. Includes ability to change chart colors and options. Works with Excel for Windows and Mac. Ключевые слова:
excel gantt chart, excel gantt chart template, gantt chart excel, excel gant chart, excel gant chart template
Скачать бесплатно! (747 Kb)
|
|
Страница: 1
| 2
| 3 | 4
| 5
|
|
|
|
