|

|
TeeChart Pro ActiveX
TeeChart ActiveX charting component offers hundreds of Graph styles in 2D and 3D, 56 mathematical and statistical Functions for you to choose from together with an unlimited number of axes and 14 toolbox components. For Windows and Web applications. Ключевые слова:
ActiveX charting component, ActiveX Chart, Chart for COM, IIS, ASP
Скачать бесплатно! (32 Mb)
|
|

|
BALKAN OrgChartJS
A JavaScript library for building interactive Org-Charts, specifically tailored for displaying a company's organizational structure Ключевые слова:
orgchart js, org chart, organizational chart, org-chart html, tree js
Скачать бесплатно! (98 Kb)
|
|

|
CYTSoft Psychrometric Chart
An interactive and intelligent psychrometric chart program for HVAC engineers. It provides the most accurate and reliable data based on Hyland and Wexler's reports published by ASHRAE, which treat air and vapor as real gases, rather than ideal gases. Ключевые слова:
psychrometric, chart, HVAC, psychrometrics, thermodynamics
Скачать бесплатно! (2.35 Mb)
|
|

|
TeeChart for PHP Open Source
Object-Oriented Charting component library completely written in PHP and ready to be used in any PHP scripts. It includes full source code meaning that no loaders have to be used in order to create a Graph on servers. Ключевые слова:
php open source chart, chart graph for php, phped, zend studio, delphi for php
Скачать бесплатно! (6.55 Mb)
|
|

|
Gantt Chart Light Library
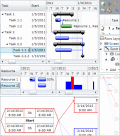
Task hierarchy and resource scheduling components for Silverlight?„? 4 / WPF and .NET 4 Ключевые слова:
Gantt, schedule, PERT, chart, network
Скачать бесплатно! (10 Mb)
|
|

|
GetOrgChart
A JavaScript library for building interactive flow charts, specifically tailored for displaying a company's organizational chart Ключевые слова:
orgchart, orgcanizational chart, orgchart html
Скачать бесплатно! (615 Kb)
|
|

|
PlotLab .NET
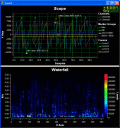
PlotLab is a set of .NET 2.0/3.5 components for very easy and fast Data Visualization. Allows very fast display in a Plot/Scope/Chart or Waterfall form. Great for FFT Visualization! Free for non-commercial use. Ключевые слова:
Chart, Scope, Plot, Waterfall, Plotting
Скачать бесплатно! (32 Mb)
|
|

|
PlotLab VC++
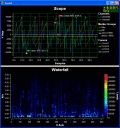
PlotLab is a set of Visual C++ components for very easy and fast Data Visualization. They allow very fast display in a Plot/Scope/Chart or Waterfall form. Great for FFT Visualization! Free for non-commercial use. Ключевые слова:
Chart, Scope, Plot, Waterfall, Plotting
Скачать бесплатно! (32 Mb)
|
|

|
PatternExplorer for Amibroker
The PatternExplorer for Amibroker is designed to improve your trading performance significantly and to make it much easier than ever before to find profitable trading patterns. You can find your favorite patterns with just a few mouse clicks. Ключевые слова:
PatternExplorer, Amibroker, Pattern Recognition, Rainbow Chart, Support Resistance
Скачать бесплатно! (2.82 Mb)
|
|

|
AnyChart Flash Chart Component
Anychart набор Flash (SWF) файлов позволяющий создавать анимированные графики. Компонент позволяет создавать компактные, интерактивные и красивые графики. Управляется XML интерфейсом. Не требует инсталяции. Легок во внедрении в сайт и приложение. Ключевые слова:
AnyChart, Chart, Graphs, Macromedia, Flash
Скачать бесплатно! (7.03 Mb)
|
|
Страница: 1
| 2
| 3
| 4
| 5
|
|
|
|
