|

|
Forex Rate Chart
Forex rate chart with currency conversion, updated real time, freeware (no spyware) Great for Foreign Exchange Traders. Ключевые слова:
forex, currency converter, forex chart, forex rates
Скачать бесплатно! (671 Kb)
|
|

|
Excel Gantt Chart Template Deluxe
Excel Gantt Chart Template. Create Gantt charts in Excel. Manage daily, weekly and monthly projects in Excel. Manage up to 100 tasks and team members. Includes ability to change chart colors and options. Works with Excel for Windows and Mac. Ключевые слова:
excel gantt chart, excel gantt chart template, gantt chart excel, excel gant chart, excel gant chart template
Скачать бесплатно! (747 Kb)
|
|

|
Live Forex Charts
Free, simple and powerful live forex charts software provides traders with comprehensive view of the online trading charts and access to currency movements. Real-time fx and currency charts with technical indicators and online forex charting tool. Ключевые слова:
forex charts, forex chart, fx charts, forex charting, real time forex chart
Скачать бесплатно! (1.71 Mb)
|
|

|
ManageXPS
* A-O-N genration* Gantt chart genration.* Critical path and various float calculation.* Resource profile genration.* Resource leveling through simulation.* Resource allocation based on various priority rules.* Project crashing under dev. Ключевые слова:
project management, resource leveling, gantt chart
Скачать бесплатно! (140 Kb)
|
|

|
Nevron Chart for SSRS
Nevron Chart for SSRS (market's leader for its visual style, effects,layout features and data integration) is a solution,designed to provide an easy and powerful way to implement state-of-art charts in any report, modified with MS Reporting Services. Ключевые слова:
Reporting Services, Chart, SQL Reporting Services, SQL, Dashboards
Скачать бесплатно! (32 Mb)
|
|
|
Manco.Chart for .NET
Manco.Chart for .NET is a powerful charting component used to create attractive 3D and 2D charts for desktop applications and web pages using .NET technologies. 3D charting uses the OpenGL graphics engine to create sophisticated 3D charts and graphs. Ключевые слова:
.NET, chart, control, charting, Windows
Скачать бесплатно! (6.46 Mb)
|
|
|
PatternExplorer for Amibroker
The PatternExplorer for Amibroker is designed to improve your trading performance significantly and to make it much easier than ever before to find profitable trading patterns. You can find your favorite patterns with just a few mouse clicks. Ключевые слова:
PatternExplorer, Amibroker, Pattern Recognition, Rainbow Chart, Support Resistance
Скачать бесплатно! (2.82 Mb)
|
|

|
AnyChart Flash Chart Component
Anychart набор Flash (SWF) файлов позволяющий создавать анимированные графики. Компонент позволяет создавать компактные, интерактивные и красивые графики. Управляется XML интерфейсом. Не требует инсталяции. Легок во внедрении в сайт и приложение. Ключевые слова:
AnyChart, Chart, Graphs, Macromedia, Flash
Скачать бесплатно! (7.03 Mb)
|
|

|
SmartChart XP
Smart-Chart is a MS-Excel based application that automatically creates Flow-Charts. The usability and advantage of these Flow-Charts have been increased immensely compared to the traditional Flow-Chart approach. Ключевые слова:
Flow-Chart, Microsoft Excel, MS-Excel, Excel, Chart-Tool
Скачать бесплатно! (844 Kb)
|
|
|
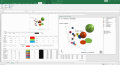
5dchart Add-In for MS Excel
5dchart Add-In (for Microsoft Office Excel) provides unmatched flexibility and highly customizable bubble-chart visualization for complex multi-dimensional data. Ключевые слова:
bubble chart, 3D bubble chart, scatter plot, 3D scatter plot, chart generator
Скачать бесплатно! (6.42 Mb)
|
|
Страница: 1
| 2
| 3
| 4 | 5
|
|
|
|
